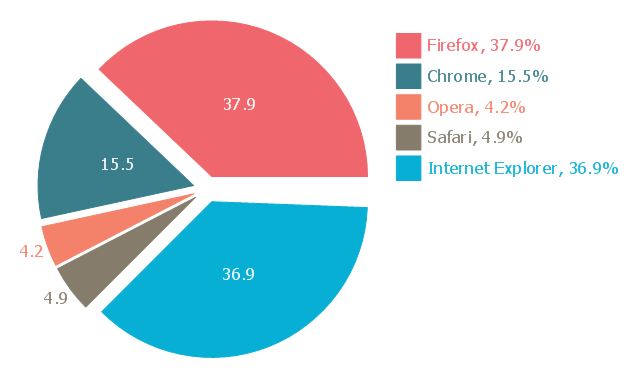
This exploded pie chart sample shows the Europe browser usage share in January 2011. It was designed on the base of the Wikimedia Commons file: 2011 01 Europe Browser share crop.png.
[commons.wikimedia.org/ wiki/ File:2011_ 01_ Europe_ Browser_ share_ crop.png]
This file is licensed under the Creative Commons Attribution 3.0 Unported license. [creativecommons.org/ licenses/ by/ 3.0/ deed.en]
"A chart with one or more sectors separated from the rest of the disk is known as an exploded pie chart. This effect is used to either highlight a sector, or to highlight smaller segments of the chart with small proportions." [Pie chart. Wikipedia]
The exploded pie chart example "Europe browser usage share" was created using the ConceptDraw PRO diagramming and vector drawing software extended with the Pie Charts solution of the Graphs and Charts area in ConceptDraw Solution Park.
Exploded pie chart
 Entity-Relationship Diagram (ERD)
Entity-Relationship Diagram (ERD) solution extends ConceptDraw PRO software with templates, samples and libraries of vector stencils from drawing the ER-diagrams by Chen's and crow’s foot notations.
HelpDesk
How to Create a Picture Graph in ConceptDraw PRO

 Picture Graphs
Typically, a Picture Graph has very broad usage. They many times used successfully in marketing, management, and manufacturing. The Picture Graphs Solution extends the capabilities of ConceptDraw PRO v10 with templates, samples, and a library of professionally developed vector stencils for designing Picture Graphs.
 Marketing Diagrams
This solution extends ConceptDraw PRO with samples, templates and library of design elements for drawing the marketing diagrams.
 Germany Map
The Germany Map solution contains collection of samples, templates and scalable vector stencil graphic maps, representing map of Germany and all 16 states of Germany. Use the Germany Map solution from ConceptDraw Solution Park as the base for various them
 Android User Interface
The Android User Interface solution allows ConceptDraw PRO act as an Android UI design tool. Libraries and templates contain a variety of Android GUI elements to help users create images based on Android UI design.
- Pie Chart Of Crop Production In India
- Europe browser usage share | Piechart Related To Agricultural Crops
- Pie Charts | Area Charts | Education Package | Example Of Pie ...
- Area Charts | Education Package | Management Consultant | Pie ...
- Pie Chart Examples and Templates | Donut Chart Templates ...
- Bar Chart Examples
- Pie Chart Examples and Templates | Atmosphere air composition ...
- Pie Charts | Pie Chart Of Indian Farming
- Chart Templates | Chart Examples | Pie Charts | Percentage Chart Png
- Pie Chart Examples and Templates | Exploded pie chart ...
- Area Charts | Pie Charts Of Agriculture In India
- Pie Chart Diagrams Related To Agriculture
- Agriculture Related Pie Chart
- Area Charts | Bar Garph Chart Of Crop Production In India
- Example Of Agricultural Pie Graph
- Pie Chart Of Indian Economy
- Crop Agricultural Practices Flow Chart
- Pie Charts Of Indian Economy
- Sector diagram - Template | How To Create Onion Diagram | Pie ...
- Education Information | Pie Chart Of Sectors Of Indian Economy