This picture bar graph sample shows regional population growth from 2010 to 2016. It was designed using data from the Wikipedia article List of continents by population.
[en.wikipedia.org/ wiki/ List_ of_ continents_ by_ population]
"Population geography is a division of human geography. It is the study of the ways in which spatial variations in the distribution, composition, migration, and growth of populations are related to the nature of places. Population geography involves demography in a geographical perspective. It focuses on the characteristics of population distributions that change in a spatial context." [Population geography. Wikipedia]
The pictorial chart example "Regional population growth from 2010 to 2016" was created using the ConceptDraw PRO diagramming and vector drawing software extended with the Picture Graphs solution from the Graphs and Charts area of ConceptDraw Solution Park.
Image chart

Gantt chart examples

How to Draw a Natural Landscape
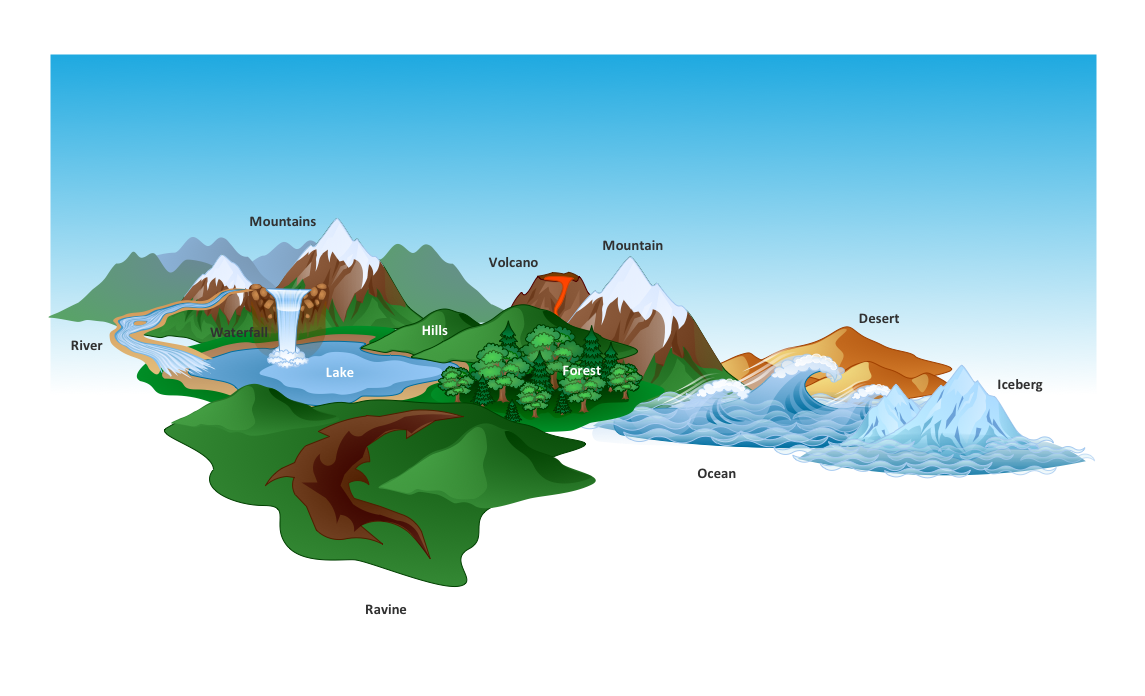
Beautiful Nature Scene: Drawing

Drawing Illustration

 Picture Graphs
Typically, a Picture Graph has very broad usage. They many times used successfully in marketing, management, and manufacturing. The Picture Graphs Solution extends the capabilities of ConceptDraw DIAGRAM with templates, samples, and a library of professionally developed vector stencils for designing Picture Graphs.
HelpDesk
How to Draw a Map of North America

Pie Chart Word Template. Pie Chart Examples

Nature Drawings - How to Draw
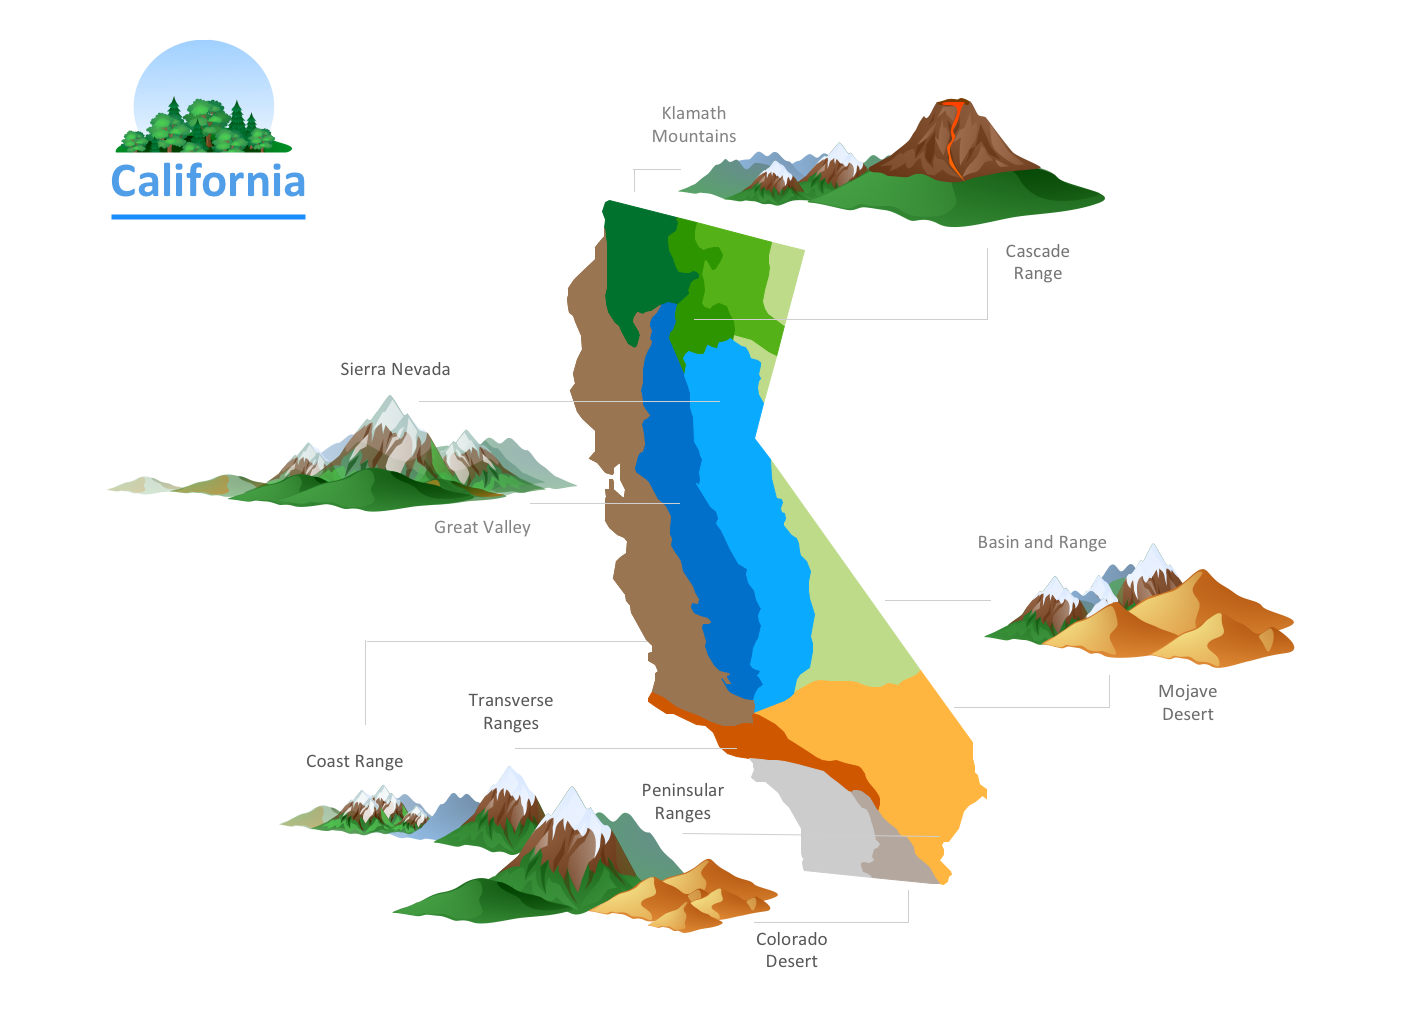
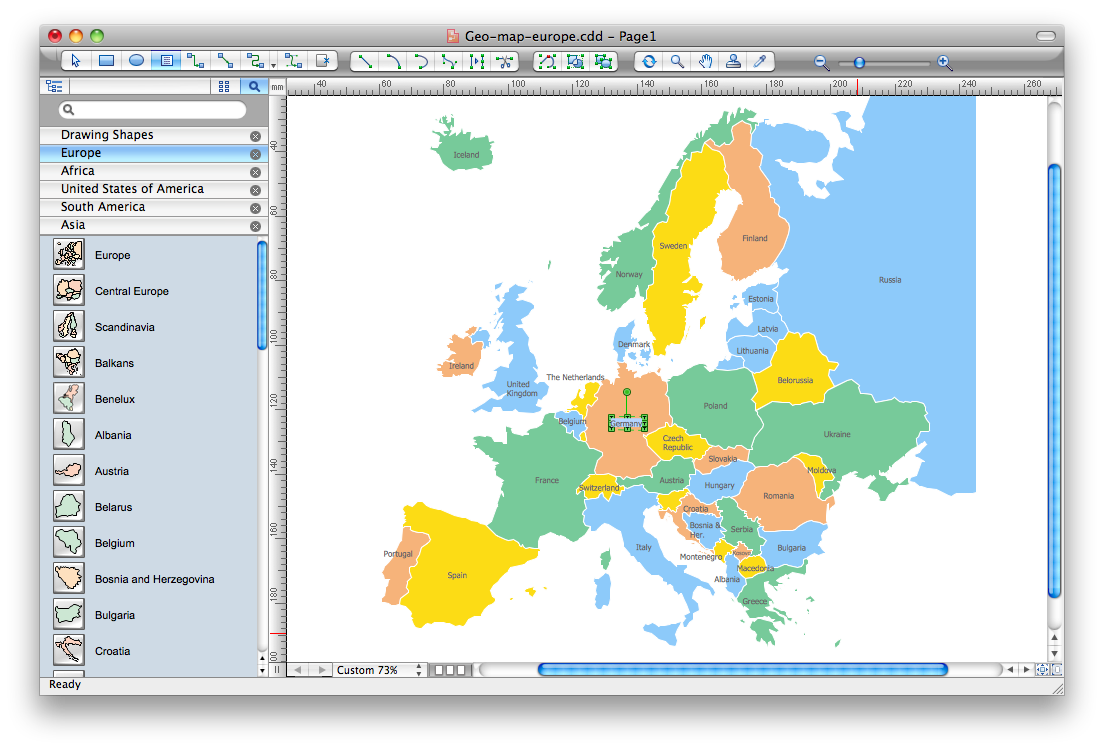
Map Software
- Bar Charts | Picture Graph | Basic Divided Bar Diagrams | Divided ...
- Geography Related Picture Easy To Draw
- Flow Chart Of Nature Of Geography
- Human Resource In Geography Images To Draw
- How To Draw A Easy Geography Picture
- Animals Pictures
- Images On World Population For Chart Making
- Line Chart Examples | Line Graph | Pictures of Graphs | Population ...
- Basic Diagramming | Regional population growth from 2010 to 2016 ...
- Barrie population - Picture bar graph | Regional population growth ...