"Ishikawa diagrams (also called fishbone diagrams, herringbone diagrams, cause-and-effect diagrams, or Fishikawa) are causal diagrams created by Kaoru Ishikawa (1968) that show the causes of a specific event. Common uses of the Ishikawa diagram are product design and quality defect prevention, to identify potential factors causing an overall effect. Each cause or reason for imperfection is a source of variation. Causes are usually grouped into major categories to identify these sources of variation. The categories typically include:
- People: Anyone involved with the process
- Methods: How the process is performed and the specific requirements for doing it, such as policies, procedures, rules, regulations and laws
- Machines: Any equipment, computers, tools, etc. required to accomplish the job
- Materials: Raw materials, parts, pens, paper, etc. used to produce the final product
- Measurements: Data generated from the process that are used to evaluate its quality
- Environment: The conditions, such as location, time, temperature, and culture in which the process operates" [Ishikawa diagram. Wikipedia]
The fishbone diagram example "Causes of low-quality output" was created using the ConceptDraw PRO diagramming and vector drawing software extended with the Fishbone Diagrams solution from the Management area of ConceptDraw Solution Park.
Ishikawa diagram

HelpDesk
How to Create a Fault Tree Analysis Diagram (FTD) in ConceptDraw PRO

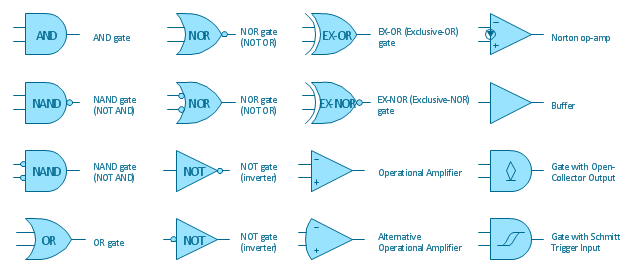
The vector stencils library "Logic gate diagram" contains 17 element symbols for drawing the logic gate diagrams.
"To build a functionally complete logic system, relays, valves (vacuum tubes), or transistors can be used. The simplest family of logic gates using bipolar transistors is called resistor-transistor logic (RTL). Unlike simple diode logic gates (which do not have a gain element), RTL gates can be cascaded indefinitely to produce more complex logic functions. RTL gates were used in early integrated circuits. For higher speed and better density, the resistors used in RTL were replaced by diodes resulting in diode-transistor logic (DTL). Transistor-transistor logic (TTL) then supplanted DTL. As integrated circuits became more complex, bipolar transistors were replaced with smaller field-effect transistors (MOSFETs); see PMOS and NMOS. To reduce power consumption still further, most contemporary chip implementations of digital systems now use CMOS logic. CMOS uses complementary (both n-channel and p-channel) MOSFET devices to achieve a high speed with low power dissipation." [Logic gate. Wikipedia]
The symbols example "Design elements - Logic gate diagram" was drawn using the ConceptDraw PRO diagramming and vector drawing software extended with the Electrical Engineering solution from the Engineering area of ConceptDraw Solution Park.
Logic gate symbols
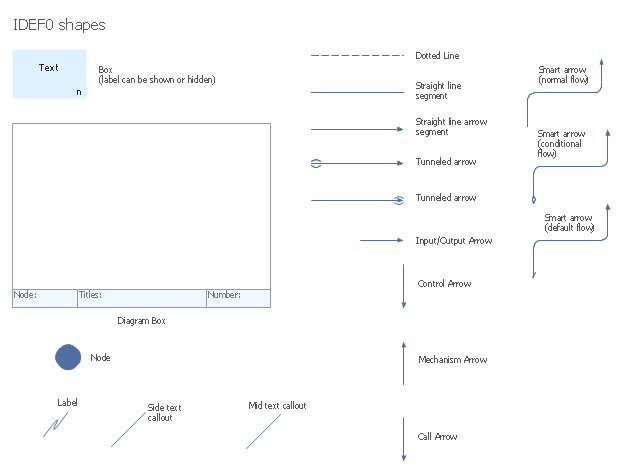
The vector stencils library "IDEF0 diagrams" contains 18 symbols for drawing IDEF0 function modeling diagrams using the ConceptDraw PRO diagramming and vector drawing software.
"The IDEF0 model ... is based on a simple syntax. Each activity is described by a verb-based label placed in a box. Inputs are shown as arrows entering the left side of the activity box while output are shown as exiting arrows on the right side of the box. Controls are displayed as arrows entering the top of the box and mechanisms are displayed as arrows entering from the bottom of the box. Inputs, Controls, Outputs, and Mechanisms are all referred to as concepts.
- Arrow : A directed line, composed of one or more arrow segments, that models an open channel or conduit conveying data or objects from source (no arrowhead) to use (with arrowhead). There are 4 arrow classes: Input Arrow, Output Arrow, Control Arrow, and Mechanism Arrow (includes Call Arrow). See Arrow Segment, Boundary Arrow, Internal Arrow.
- Box : A rectangle, containing a name and number, used to represent a function.
- Context : The immediate environment in which a function (or set of functions on a diagram) operates.
- Decomposition : The partitioning of a modeled function into its component functions.
- Fork : The junction at which an IDEF0 arrow segment (going from source to use) divides into two or more arrow segments. May denote unbundling of meaning.
- Function : An activity, process, or transformation (modeled by an IDEF0 box) identified by a verb or verb phrase that describes what must be accomplished.
- Join : The junction at which an IDEF0 arrow segment (going from source to use) merges with one or more other arrow segments to form a single arrow segment. May denote bundling of arrow segment meanings.
- Node : A box from which child boxes originate; a parent box. See Node Index, Node Tree, Node Number, Node Reference, Diagram Node Number." [IDEF0. Wikipedia]
The example "Design elements - IDEF0 diagram" is included in the IDEF0 Diagrams solution from the Software Development area of ConceptDraw Solution Park.
IDEF0 symbols
- Fishbone diagram - Causes of low-quality output | Design elements ...
- Input Process Output Design Flow
- Fishbone diagram - Causes of low-quality output | Total Quality ...
- Input Process Output Diagram Example
- Basic Flowchart Symbols and Meaning | Design elements - IDEF0 ...
- Design elements - Logic gate diagram
- Input Output Process Diagram
- Total Quality Management with ConceptDraw | Fishbone diagram ...
- Electrical Symbols — Logic Gate Diagram | Design elements - Logic ...
- Design elements - Logic gate diagram | Logic gate diagram ...
- Fishbone diagram - Causes of low-quality output | Fishbone ...
- Structured Systems Analysis and Design Method (SSADM) with ...
- Data Flow Diagram
- Data Flow Diagram Symbols. DFD Library | Data Flow Diagram ...
- Input Output Diagram Creator
- Fishbone diagram - Causes of low-quality output | Quality fishbone ...
- Fishbone diagram - Causes of low-quality output | TQM Diagram ...
- How The Step Input Process And Output Are Graphically Shown In
- Fishbone Diagram | Management | Fishbone diagram - Causes of ...
- System Diagram Examples Input Output