"Long-range Wi-Fi is used for low-cost, unregulated point-to-point computer network connections, as an alternative to other fixed wireless, cellular networks or satellite Internet access.
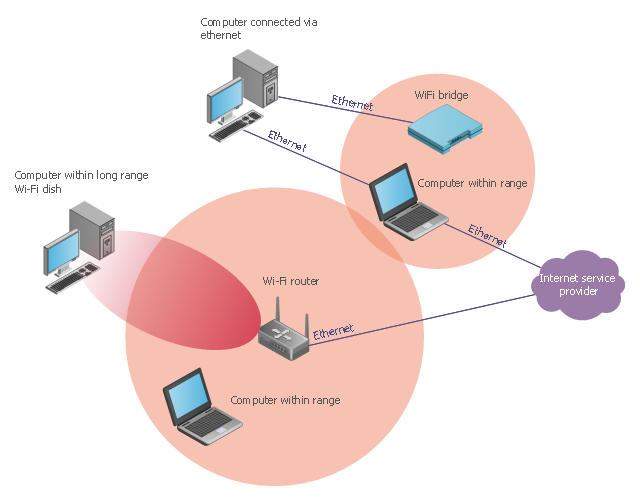
Wi-Fi networks have a range that's limited by the transmission power, antenna type, the location they're used in, and the environment. A typical wireless router in an indoor point-to-multipoint arrangement using 802.11b or 802.11g and a stock antenna might have a range of 32 metres (105 ft). Outdoor point-to-point arrangements, through use of directional antennas, can be extended with many kilometers between stations." [Long-range Wi-Fi. Wikipedia]
The wireless network diagram example "Long-range Wi-Fi network diagram" was created using the ConceptDraw PRO diagramming and vector drawing software extended with the Wireless Networks solution from the Computer and Networks area of ConceptDraw Solution Park.
Wireless network diagram
 Computer and Network Package
Computer and Network Package is a large set of valuable graphical solutions from ConceptDraw Solution Park, developed and specially selected to help computer network specialists and IT professionals to realize their daily work the most efficiently and quickly. This package contains extensive set of graphic design tools, ready-to-use vector elements, built-in templates and samples for designing professional-looking diagrams, charts, schematics and infographics in a field of computer network technologies, cloud computing, vehicular networking, wireless networking, ensuring networks security and networks protection. It is useful for designing different floor plans and layout plans for homes, offices, hotels and instantly construction detailed schemes of computer networks and wireless networks on them, for making professional-looking and colorful Pie Charts, Bar Graphs and Line Charts visualizing the relevant information and data.
- Wireless networks - Vector stencils library | Guesthouse Network ...
- Wireless access point - Network diagram | Cisco - Vector stencils ...
- Wireless Antenna Vector
- Long-range Wi-Fi network diagram | Wireless networks - Vector ...
- Wireless networks - Vector stencils library | Guesthouse Network ...
- Long-range Wi-Fi network diagram | Wifi Long Range Antenna ...
- Hotel Network Topology Diagram. Hotel Guesthouse WiFi Network ...
- Hotel Network Topology Diagram. Hotel Guesthouse WiFi Network ...
- Wireless access point - Network diagram | Computers and network ...
- TV, Photo and Video - Vector stencils library | TV, Photo and Video ...
- Wireless networks - Vector stencils library | Hotel Network Topology ...
- Computers and network isometric - Vector stencils library | Cloud ...
- Cisco multimedia, voice, phone - Vector stencils library ...
- Cloud Network Vector Png
- Network Gateway Router | Wireless networks - Vector stencils library ...
- Telecommunication networks - Vector stencils library | Computers ...
- Telecommunication networks - Vector stencils library ...
- Television Antenna Icons
- Network hardware - Vector stencils library | Telecommunication ...
- Telecommunication networks - Vector stencils library ...