The vector stencils library "Organizational chart" contains 17 symbols for drawing organizational charts using the ConceptDraw PRO diagramming and vector drawing software.
"An organizational chart (often called organization chart, org chart, organigram(me), or organogram(me)) is a diagram that shows the structure of an organization and the relationships and relative ranks of its parts and positions/ jobs. The term is also used for similar diagrams, for example ones showing the different elements of a field of knowledge or a group of languages." [Organizational chart. Wikipedia]
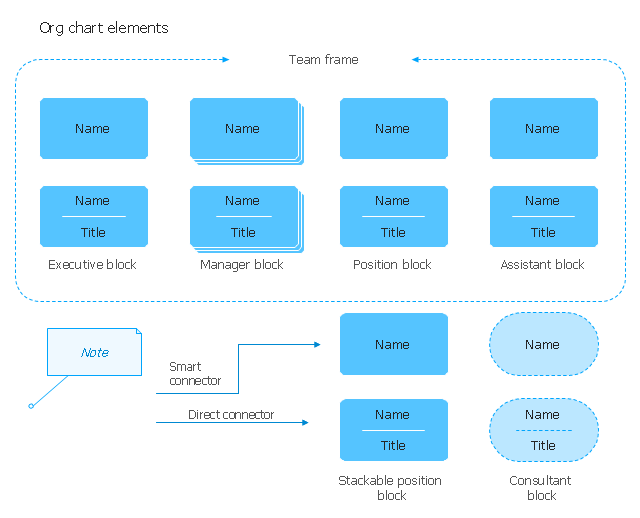
The example "Design elements - Organizational chart" is included in the Organizational Charts solution from the Management area of ConceptDraw Solution Park.
"An organizational chart (often called organization chart, org chart, organigram(me), or organogram(me)) is a diagram that shows the structure of an organization and the relationships and relative ranks of its parts and positions/ jobs. The term is also used for similar diagrams, for example ones showing the different elements of a field of knowledge or a group of languages." [Organizational chart. Wikipedia]
The example "Design elements - Organizational chart" is included in the Organizational Charts solution from the Management area of ConceptDraw Solution Park.
Organizational chart elements
 25 Typical Orgcharts
The 25 Typical Orgcharts solution contains powerful organizational structure and organizational management drawing tools, a variety of professionally designed organization chart and matrix organization structure samples, 25 templates based on various orga
Business diagrams & Org Charts with ConceptDraw DIAGRAM


"In elementary algebra, a quadratic equation (from the Latin quadratus for "square") is any equation having the form
ax^2+bx+c=0
where x represents an unknown, and a, b, and c are constants with a not equal to 0. If a = 0, then the equation is linear, not quadratic. The constants a, b, and c are called, respectively, the quadratic coefficient, the linear coefficient and the constant or free term.
Because the quadratic equation involves only one unknown, it is called "univariate". The quadratic equation only contains powers of x that are non-negative integers, and therefore it is a polynomial equation, and in particular it is a second degree polynomial equation since the greatest power is two.
Quadratic equations can be solved by a process known in American English as factoring and in other varieties of English as factorising, by completing the square, by using the quadratic formula, or by graphing." [Quadratic equation. Wikipedia]
The flowchart example "Solving quadratic equation algorithm" was created using the ConceptDraw PRO diagramming and vector drawing software extended with the Mathematics solution from the Science and Education area of ConceptDraw Solution Park.
Solving quadratic equation flow chart

- Organizational Chart Template | Orgchart | How to Draw an ...
- Organigrams with ConceptDraw PRO | Design elements ...
- How to Draw an Organization Chart | Organizational Structure ...
- Organizational Structure | Matrix Organization Structure | Business ...
- Organizational Structure | How to Draw an Organizational Chart ...
- Organizational Chart Template | ConceptDraw PRO - Organizational ...
- How to Draw an Organization Chart | Marketing and Sales ...
- How to Draw an Organization Chart | Orgchart | Organization Chart ...
- Organizational Chart Symbols
- ConceptDraw PRO - Organizational chart software | Business ...
- Business Board Org Chart | Horizontal Org Flow Chart | How to Draw ...
- How to Draw an Organization Chart | Pie Chart Examples and ...
- Examples of Flowcharts, Org Charts and More | How to Draw an ...
- Horizontal Org Flow Chart | Cross-Functional Flowchart | Horizontal ...
- Organization chart - Foodbank | Examples of Flowcharts, Org Charts ...
- How to Create Organizational Chart Quickly | How to Draw an ...
- 25 Typical Orgcharts | Organizational Charts with ConceptDraw ...
- Organogram Software | Organizational Chart | 25 Typical Orgcharts ...
- How to Draw an Organization Chart | Orgchart | Create ...
- Organizational Structure | ConceptDraw PRO - Organizational chart ...