"iOS (previously iPhone OS) is a mobile operating system developed and distributed by Apple Inc. ...
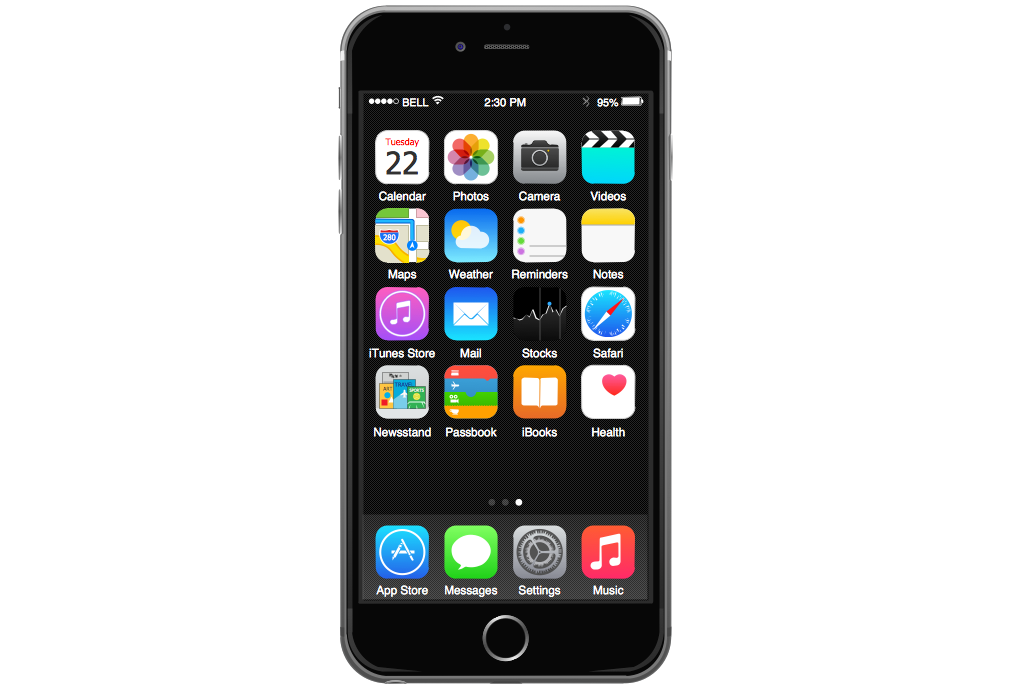
The user interface of iOS is based on the concept of direct manipulation, using multi-touch gestures. Interface control elements consist of sliders, switches, and buttons. Interaction with the OS includes gestures such as swipe, tap, pinch, and reverse pinch, all of which have specific definitions within the context of the iOS operating system and its multi-touch interface. Internal accelerometers are used by some applications to respond to shaking the device (one common result is the undo command) or rotating it in three dimensions (one common result is switching from portrait to landscape mode)." [iOS. Wikipedia]
The example "iPhone OS (iOS) graphic user interface (GUI) - More function view" was created using the ConceptDraw PRO diagramming and vector drawing software extended with the Graphic User Interface solution from the Software Development area of ConceptDraw Solution Park.
iPhone GUI
-graphic-user-interface-(gui)---more-function-view.png--diagram-flowchart-example.png)
Android GUI
 Android User Interface
The Android User Interface solution allows ConceptDraw DIAGRAM act as an Android UI design tool. Libraries and templates contain a variety of Android GUI elements to help users create images based on Android UI design.
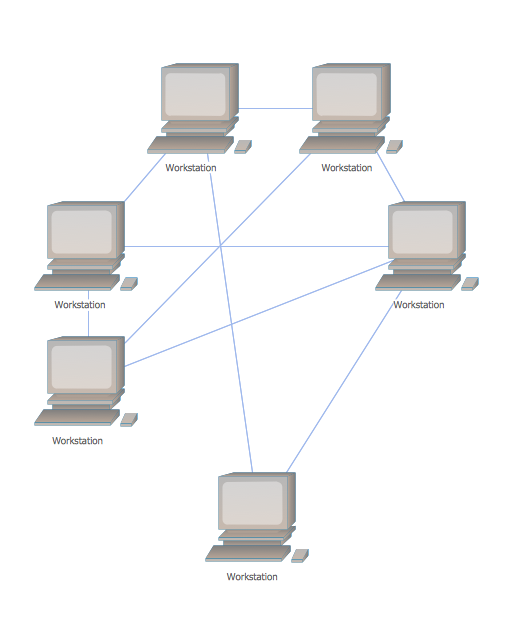
Mesh Network Topology Diagram
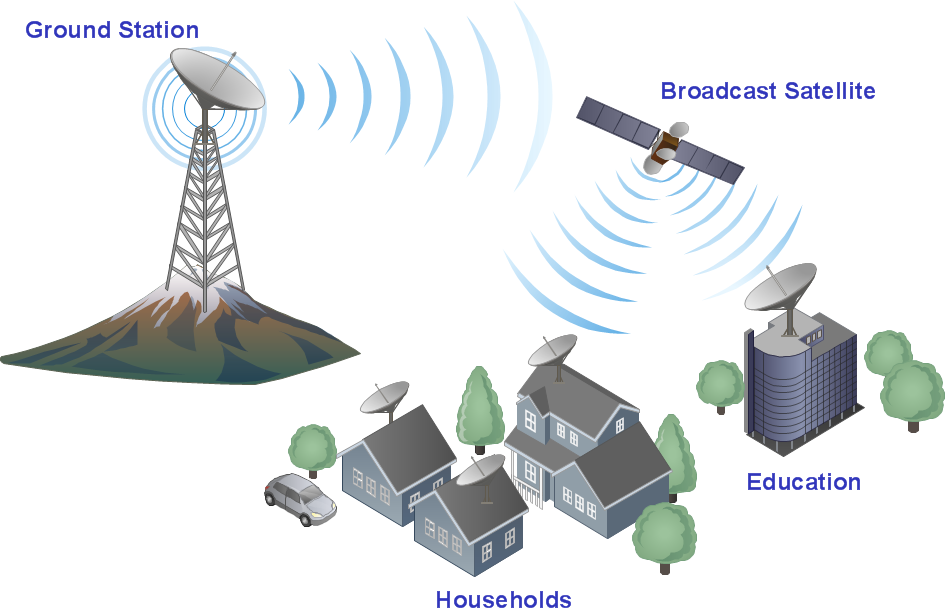
Wireless Network Topology

Example of DFD for Online Store (Data Flow Diagram)


UI Patterns
How To Draw an iPhone?
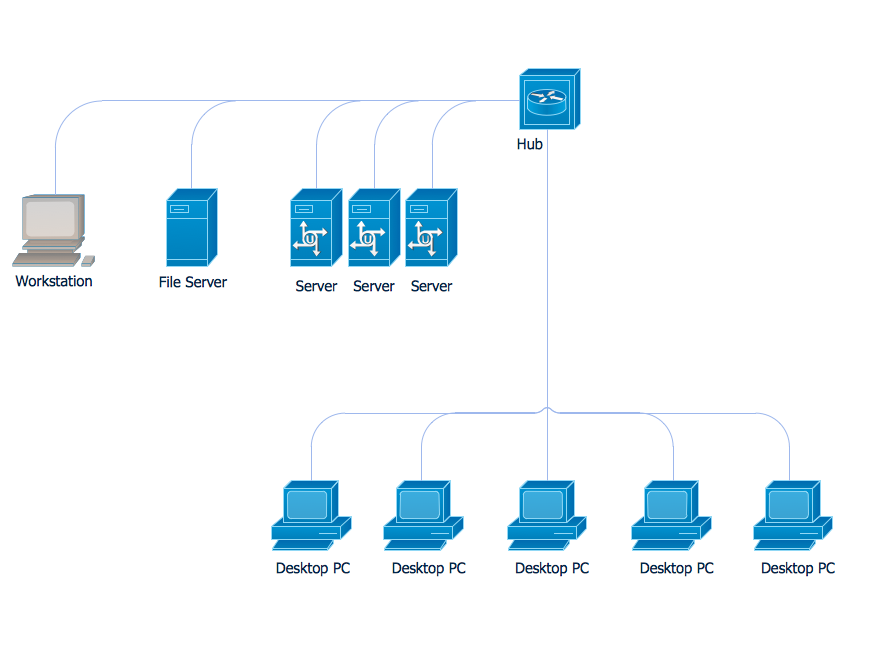
Communication Network Topology
HelpDesk
How to Connect a Live Object to a Text Data Source

Wireless Networking for Mac
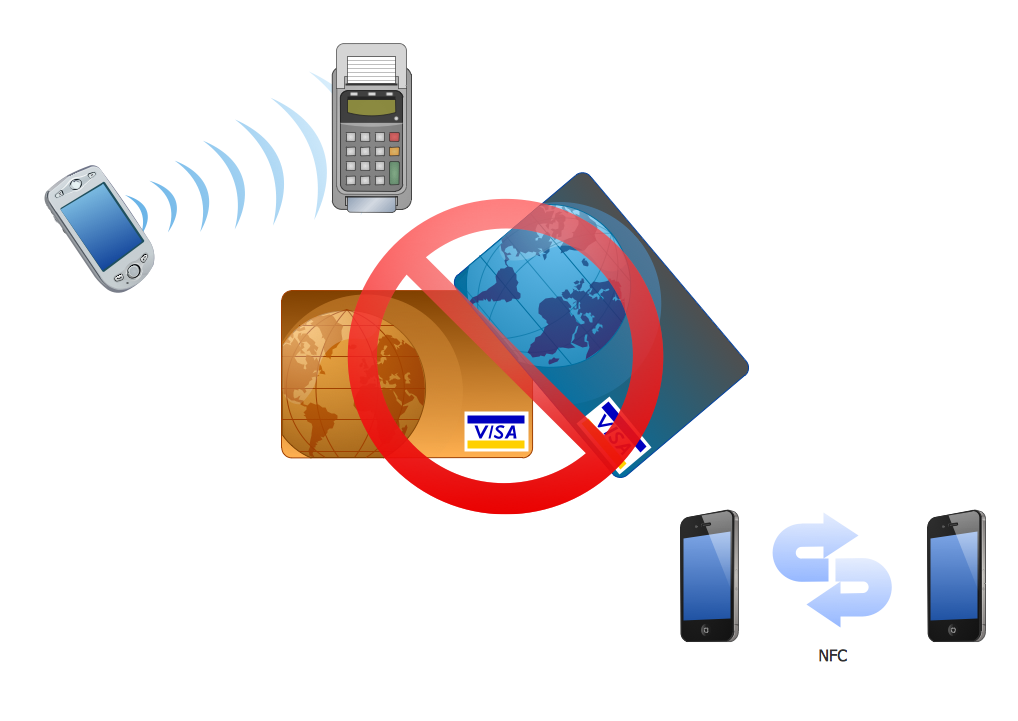
Near field communication (NFC). Computer and Network Examples

How To Create Project Report

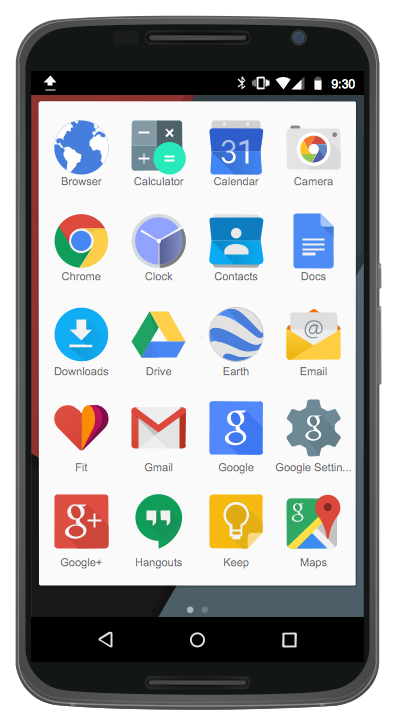
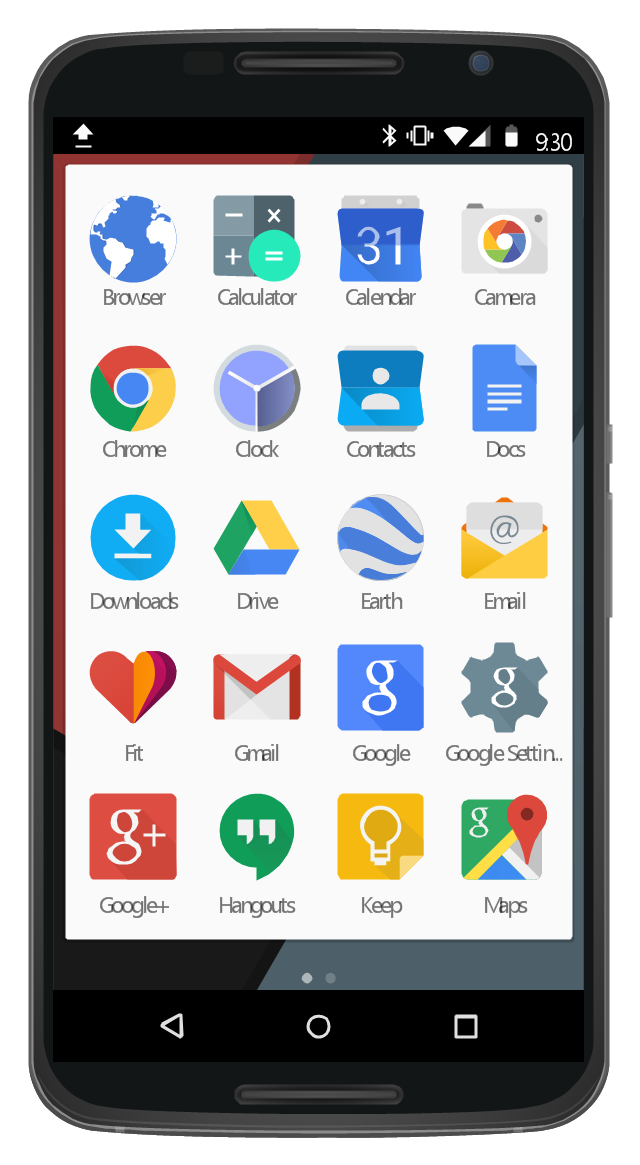
This UI design example shows common icons of Android applications on the App Drawer screen of Google Nexus 6 smartphone.
The user interface design example "Android 5.0 - App drawer" was created using the ConceptDraw PRO diagramming and vector drawing software extended with the "Android user interface" solution from the "Software Development" area of ConceptDraw Solution Park.
The user interface design example "Android 5.0 - App drawer" was created using the ConceptDraw PRO diagramming and vector drawing software extended with the "Android user interface" solution from the "Software Development" area of ConceptDraw Solution Park.
App Drawer UI
 Venn Diagrams
Venn Diagrams are actively used to illustrate simple set relationships in set theory and probability theory, logic and statistics, mathematics and computer science, linguistics, sociology, and marketing. Venn Diagrams are also often used to visually summarize the status and future viability of a project.
- Operating Common Ict Gadgets Computer
- Common Ict Gadget
- Computer Ict Gadgets
- Www Common I C T Gadget Or Tools And Their Uses
- Common Ict Gadgets
- List Of Ict Based Gadget And How To Operate Them
- Operating Common It Gadgets
- Common Gadget
- Ict Gadget Wikipedia
- A Diagram Of Ict Gadget
- What Is Operation Of Ict Gadget
- Commom Ict Gadget
- Types Of Ict Gadget
- Ict Based Gadgets And How They Operate
- Image Of Ict Gadget
- Images Of Ict Gadget
- Explain Five Ict Gadget
- Ict Based Gadgets And How To Operate Them
- Ict Gadget Meaning
- Ict Based Gadgets And Their Various Operations