This marketing diagram sample illustrates leaky bucket model.
"The leaky bucket theory. The leaky bucket theory is the model that seeks to describe the process of customer gain and loss, otherwise known as customer churn. Customer retention is one of the key concepts in relationship marketing. Most companies concentrate on recruiting new customers to replace customers who move on, rather than seeking to retain customers." [Blythe J. Key Concepts in Marketing. 2009. knowledge.sagepub.com/ view/ key-concepts-in-marketing/ n5.xml]
"Customer attrition, also known as customer churn, customer turnover, or customer defection, is the loss of clients or customers.
Banks, telephone service companies, Internet service providers, pay TV companies, insurance firms, and alarm monitoring services, often use customer attrition analysis and customer attrition rates as one of their key business metrics (along with cash flow, EBITDA, etc.) because the "...cost of retaining an existing customer is far less than acquiring a new one." Companies from these sectors often have customer service branches which attempt to win back defecting clients, because recovered long-term customers can be worth much more to a company than newly recruited clients." [Customer attrition. Wikipedia]
The chart example "Leaky bucket diagram" was created using the ConceptDraw PRO diagramming and vector drawing software extended with the Marketing Diagrams solution from the Marketing area of ConceptDraw Solution Park.
Marketing chart

, t chart, decision matrix, decision tree analysis") Decision Making
Decision Making
The Decision Making solution offers the set of professionally developed examples, powerful drawing tools and a wide range of libraries with specific ready-made vector decision icons, decision pictograms, decision flowchart elements, decision tree icons, decision signs arrows, and callouts, allowing the decision maker (even without drawing and design skills) to easily construct Decision diagrams, Business decision maps, Decision flowcharts, Decision trees, Decision matrix, T Chart, Influence diagrams, which are powerful in questions of decision making, holding decision tree analysis and Analytic Hierarchy Process (AHP), visual decomposition the decision problem into hierarchy of easily comprehensible sub-problems and solving them without any efforts.
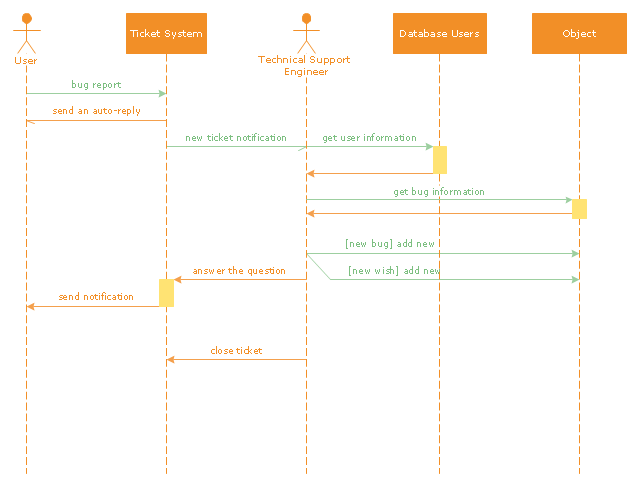
"An example scenario is presented to demonstrate how a common issue tracking system would work:
(1) A customer service technician receives a telephone call, email, or other communication from a customer about a problem. Some applications provide built-in messaging system and automatic error reporting from exception handling blocks.
(2) The technician verifies that the problem is real, and not just perceived. The technician will also ensure that enough information about the problem is obtained from the customer. This information generally includes the environment of the customer, when and how the issue occurs, and all other relevant circumstances.
(3) The technician creates the issue in the system, entering all relevant data, as provided by the customer.
(4) As work is done on that issue, the system is updated with new data by the technician. Any attempt at fixing the problem should be noted in the issue system. Ticket status most likely will be changed from open to pending.
(5) After the issue has been fully addressed, it is marked as resolved in the issue tracking system.
If the problem is not fully resolved, the ticket will be reopened once the technician receives new information from the customer. A Run Book Automation process that implements best practices for these workflows and increases IT personnel effectiveness is becoming very common." [Issue tracking system. Wikipedia]
The UML sequence diagram example "Ticket processing system" was created using the ConceptDraw PRO diagramming and vector drawing software extended with the Rapid UML solution from the Software Development area of ConceptDraw Solution Park.
UML sequence diagram
How To Do A Mind Map In PowerPoint

Project —Task Trees and Dependencies

 Customer Journey Mapping
Customer Journey Mapping Solution for ConceptDraw DIAGRAM opens incredibly broad opportunities for marketing and business specialists, product managers, designers, engineers, and other people interested in business development, increasing the product’s audience, its success and users' demand, providing them with capabilities of customer journey mapping. The included diagramming and customer journey mapping tools, predesigned vector customer journey mapping icons and charts, consumer journey mapping connectors, user journey and customer mapping figures, customer experience map icons and touchpoint icons, quick-start templates and samples provide excellent conditions for the customer journey mapping process, for creating Customer Journey Map and Customer Experience Map.
ISO-9001

- ConceptDraw News | New version of ConceptDraw Note Exchange ...
- Leaky bucket diagram | New Customers Attrition Template
- ConceptDraw | Press Releases
- Location Intelligence Dashboard - New European Customers | Maps ...
- UML communication diagram - Client server access | UML ...
- Leaky bucket diagram | Customer Retention Diagram
- Response to Complaint | Customers Complaint Flow Chart
- Customer types matrix | Block diagram - Sources of customer ...
- Social Media Response Management Action Maps - software tool ...
- Idea Communication | Quality | Idea Outline | Communicate