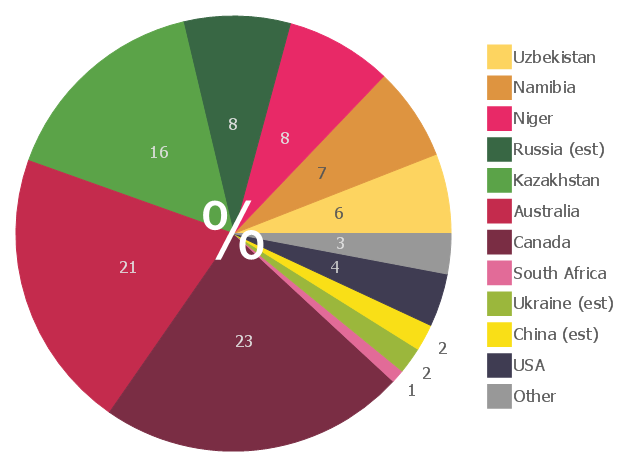
This pie chart sample shows the 2007 world uranium mining by countries.
It was designed on the base of the Wikimedia Commons file: 2007Uranium.PNG.[commons.wikimedia.org/ wiki/ File:2007Uranium.PNG]
This file is licensed under the Creative Commons Attribution 3.0 Unported license. [creativecommons.org/ licenses/ by/ 3.0/ deed.en]
"Uranium mining is the process of extraction of uranium ore from the ground. The worldwide production of uranium in 2009 amounted to 50,572 tonnes. Kazakhstan, Canada, and Australia are the top three producers and together account for 63% of world uranium production. Other important uranium producing countries in excess of 1,000 tons per year are Namibia, Russia, Niger, Uzbekistan, and the United States.
Uranium ores are normally processed by grinding the ore materials to a uniform particle size and then treating the ore to extract the uranium by chemical leaching. The milling process commonly yields dry powder-form material consisting of natural uranium, "yellowcake," which is sold on the uranium market as U3O8.
A prominent use of uranium from mining is as fuel for nuclear power plants." [Uranium mining. Wikipedia]
The pie chart example "2007 World uranium mining" was created using the ConceptDraw PRO diagramming and vector drawing software extended with the Pie Charts solution of the Graphs and Charts area in ConceptDraw Solution Park.
Pie chart
 Pie Charts
Pie Charts are extensively used in statistics and business for explaining data and work results, in mass media for comparison (i.e. to visualize the percentage for the parts of one total), and in many other fields. The Pie Charts solution for ConceptDraw PRO v10 offers powerful drawing tools, varied templates, samples, and a library of vector stencils for simple construction and design of Pie Charts, Donut Chart, and Pie Graph Worksheets.
- 2007 World uranium mining - Pie chart | Physics | Chart Of Nuclear ...
- 2007 World uranium mining | Pie Charts | Picture graphs - Vector ...
- 2007 World uranium mining | Pie Graph | Chemical elements ...
- Languages Spoken In The Usa Pie Chart With Percentages
- Exploded pie chart - European Parliament election | European ...
- Design elements - Stations | 2007 World uranium mining - Pie chart ...
- Pie Charts | Plant Layout Plans | Basic Pie Charts | Pie Charts On Plant
- Pie Chart Examples and Templates | Atmosphere air composition ...
- ERD Symbols and Meanings | UML Use Case Diagram Example ...
- Bar Graph On Food
- Physics Diagrams | Bar Diagrams for Problem Solving. Create space ...
- 2007 World uranium mining | Process Flowchart | Plant Layout Plans ...
- Pie Charts | Network Security Diagrams | How To Draw Building ...
- Picture graphs - Vector stencils library | Management indicators ...
- Pie Graph Worksheets | How to Draw a Pictorial Chart in ...
- Agriculture Related Bar Diagram
- Icon Mining
- Chart Of Gasees
- Basic Flowchart Symbols and Meaning | Pie Donut Chart . Pie Chart ...