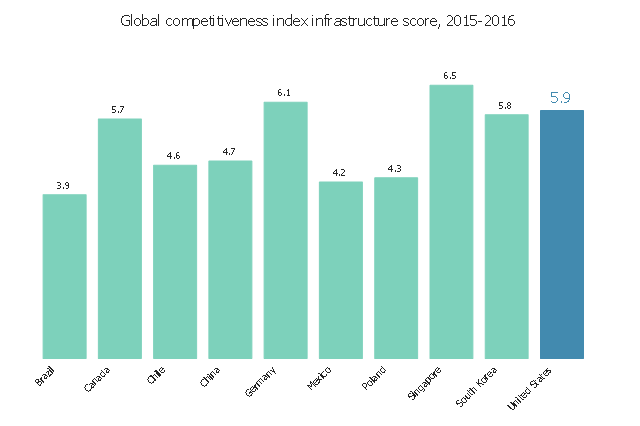
The example bar graph "Global competitiveness index infrastructure score chart, 2012-2013" was redesigned from the website "Assess Costs Everywhere" of the United States Department of Commerce. [acetool.commerce.gov/ shipping]
"The Global Competitiveness Report (GCR) is a yearly report published by the World Economic Forum. Since 2004, the Global Competitiveness Report ranks countries based on the Global Competitiveness Index, developed by Xavier Sala-i-Martin and Elsa V. Artadi. Before that, the macroeconomic ranks were based on Jeffrey Sachs's Growth Development Index and the microeconomic ranks were based on Michael Porter's Business Competitiveness Index. The Global Competitiveness Index integrates the macroeconomic and the micro/ business aspects of competitiveness into a single index." [Global Competitiveness Report. Wikipedia]
The example "Global competitiveness index infrastructure score chart, 2012-2013" was created using the ConceptDraw PRO diagramming and vector drawing software extended with the Bar Graphs solution from the Graphs and Charts area of ConceptDraw Solution Park.
www.conceptdraw.com/ solution-park/ charts-bar-graphs
Horizontal Bar Graph
 Target and Circular Diagrams
This solution extends ConceptDraw PRO software with samples, templates and library of design elements for drawing the Target and Circular Diagrams.
"Porter five forces analysis is a framework for industry analysis and business strategy development. It draws upon industrial organization (IO) economics to derive five forces that determine the competitive intensity and therefore attractiveness of a market. Attractiveness in this context refers to the overall industry profitability. An "unattractive" industry is one in which the combination of these five forces acts to drive down overall profitability. A very unattractive industry would be one approaching "pure competition", in which available profits for all firms are driven to normal profit.
Three of Porter's five forces refer to competition from external sources. The remainder are internal threats.
Porter referred to these forces as the micro environment, to contrast it with the more general term macro environment. They consist of those forces close to a company that affect its ability to serve its customers and make a profit. A change in any of the forces normally requires a business unit to re-assess the marketplace given the overall change in industry information. The overall industry attractiveness does not imply that every firm in the industry will return the same profitability. Firms are able to apply their core competencies, business model or network to achieve a profit above the industry average. A clear example of this is the airline industry. As an industry, profitability is low and yet individual companies, by applying unique business models, have been able to make a return in excess of the industry average.
Porter's five forces include - three forces from 'horizontal' competition: the threat of substitute products or services, the threat of established rivals, and the threat of new entrants; and two forces from 'vertical' competition: the bargaining power of suppliers and the bargaining power of customers.
This five forces analysis, is just one part of the complete Porter strategic models. The other elements are the value chain and the generic strategies." [Porter five forces analysis. Wikipedia]
The block diagram example "Porter's five forces model" was created using the ConceptDraw PRO diagramming and vector drawing software extended with the Block Diagrams solution from the area "What is a Diagram" of ConceptDraw Solution Park.
www.conceptdraw.com/ solution-park/ diagram-block
Block diagram

- Target and Circular Diagrams | - Conceptdraw.com
- Global competitiveness index infrastructure score chart, 2012-2013 ...
- Target and Circular Diagrams |
- Target and Circular Diagrams | Block diagram - Porter's five forces ...
- Basic Diagramming | Global competitiveness index infrastructure ...
- Small business consultancy SWOT analysis matrix | Target and ...
- Micro Macro
- Bar Graphs | Bar Chart Software | Bar Chart Examples |
- Building Drawing Software for Design Shipping and Receiving ...
- Line Graph Charting Software | Bar Chart Software | Column Chart ...
- TOWS analysis matrix diagram - instructional sample | Swot Analysis ...
- Block diagram - Six markets model | Block diagram - Porter's five ...
- Porter's value chain matrix diagram | Block diagram - Porter's five ...
- Block Diagrams | Basic Diagramming | Universal Diagramming Area |
- Remote Projects in Corporate Strategy | Swot Analysis Examples ...
- Block Diagrams | Basic Diagramming | Block Diagrams |
- Marketing | Target and Circular Diagrams | Venn Diagrams |
- How to Realize your Social Media Strategy | Build Strategies ...
- Porter's generic strategies matrix diagram | Successful Strategic Plan