In biochemistry, metabolic pathways are series of chemical reactions occurring within a cell. In each pathway, a principal chemical is modified by a series of chemical reactions. Enzymes catalyze these reactions, and often require dietary minerals, vitamins, and other cofactors in order to function properly. Because of the many chemicals (a.k.a. "metabolites") that may be involved, metabolic pathways can be quite elaborate. In addition, numerous distinct pathways co-exist within a cell. This collection of pathways is called the metabolic network. Pathways are important to the maintenance of homeostasis within an organism. Catabolic (break-down) and Anabolic (synthesis) pathways often work interdependently to create new biomolecules as the final end-products. [Metabolic pathway. Wikipedia]
This metabolic pathway map example was created using ConceptDraw PRO diagramming and vector drawing software extended with Biology solution from Science and Education area of ConceptDraw Solution Park.
https:/ / www.conceptdraw.com/ solution-park/ science-education-biology
Page1
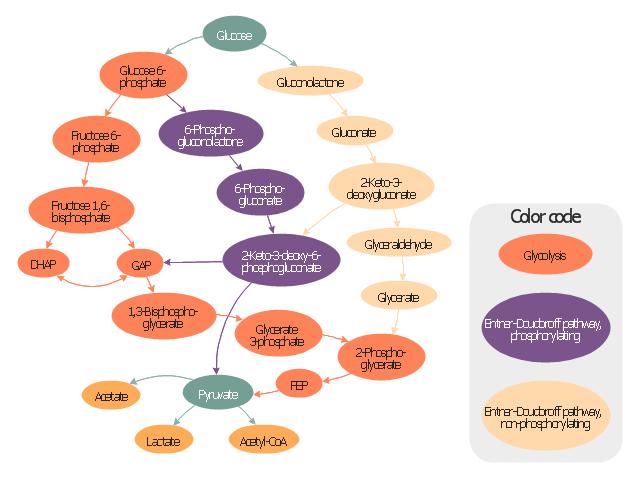
This example of carbohydrates catabolism schematical diagram displays glucose catabolic pathways map.
Organic layout graph having intermediates of glucose catabolism as nodes. Color code: Orange, glycolysis. Green, Entner-Doudoroff pathway, phosphorylating. Yellow, Entner-Doudoroff pathway, non-phosphorylating.
This methabolic pathway map diagram was redesigned using ConceptDraw PRO diagramming and vector drawing software from Commons Wikimedia file Glucose catabolism pathways.svg [https:/ / commons.wikimedia.org/ wiki/ File:Glucose_ catabolism_ pathways.svg ].
This biochemistry diagram example is included in the Biology solution from the Science and Education area of ConceptDraw Solution Park. www.conceptdraw.com/ solution-park/ science-education-biology
Page1
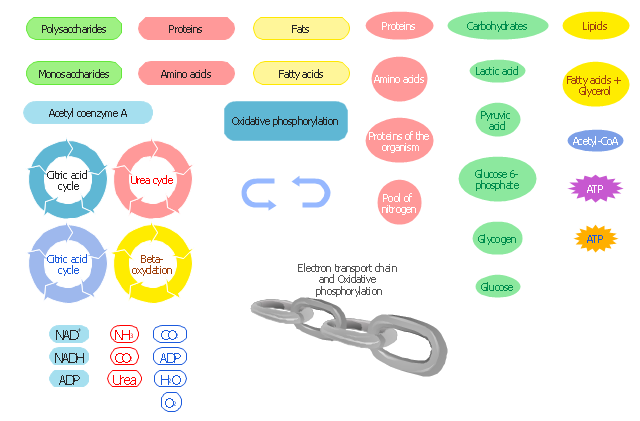
The design elements library Biochemistry of metabolism contains vector stencils of metabolites and key processes for drawing biochemical diagrams, metabolic pathways maps, and metabolism processes charts.
This shapes library for ConceptDraw PRO diagramming and vector drawing software is included in the Biology solution from Science and Education area of ConceptDraw Solution Park.
https:/ / www.conceptdraw.com/ solution-park/ science-education-biology
Page1
Citric acid cycle (tricarboxylic acid cycle, TCA cycle, Krebs cycle) is a series of chemical reactions used by all aerobic organisms to generate energy through the oxidation of acetate derived from carbohydrates, fats and proteins into carbon dioxide and chemical energy in the form of adenosine triphosphate (ATP). [Citric acid cycle. Wikipedia] This biochemical schematical diagram example shows metabolic pathways map of citric acid cycle reactions. This sample was redesigned using ConceptDraw PRO digramming and vector drawing software from the Wikimedia Commons file TCA cycle.svg [https:/ / commons.wikimedia.org/ wiki/ File:TCA_ cycle.svg ]. This image is licensed under the Creative Commons Attribution 3.0 Unported license [https:/ / creativecommons.org/ licenses/ by/ 3.0/ deed.en ].
This biochemistry diagram example is included in the Biology solution from the Science and Education area of ConceptDraw Solution Park. [ www.conceptdraw.com/ solution-park/ science-education-biology ]
Page1
.png--diagram-flowchart-example.png)
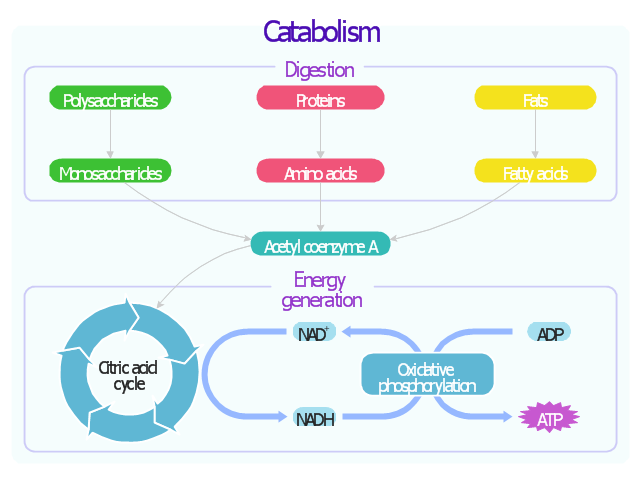
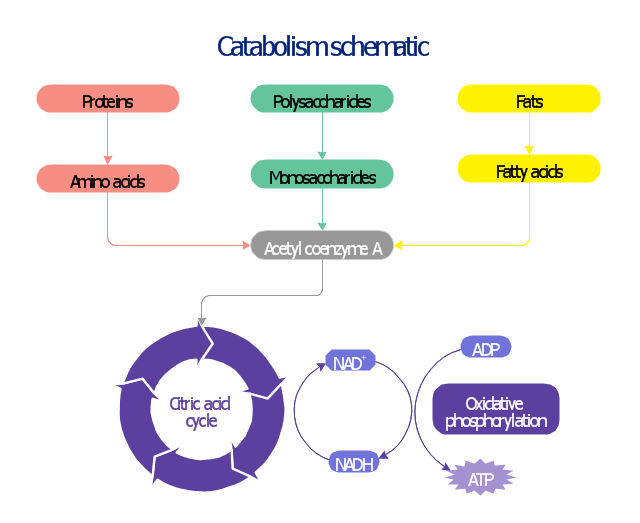
Simplified diagram of catabolism of proteins, carbohydrates and fats.
This biochemical chart display how proteins, polysaccharides and fats from food are digested into gastrointestinal tract into aminoacids, monosaccharides and fatty acids, and then broken down and oxidized to carbon dioxide and water in cellular processes of energy generation.
This metabolic pathway map was redesigned using ConceptDraw PRO diagramming and vector drawing software from Wikipedia file Catabolism schematic.svg [https:/ / en.wikipedia.org/ wiki/ File:Catabolism_ schematic.svg].
This biochemistry diagram example is included in the Biology solution from the Science and Education area of ConceptDraw Solution Park. www.conceptdraw.com/ solution-park/ science-education-biology
Page1
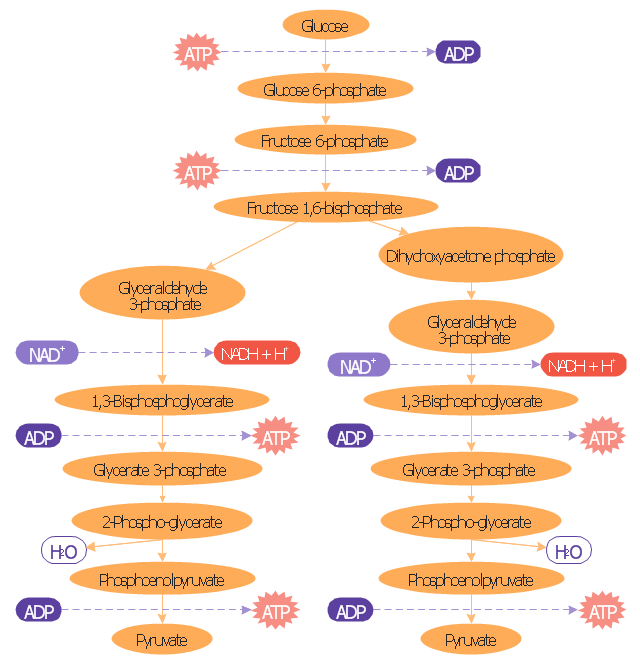
Glycolysis is the metabolic pathway that converts glucose into pyruvate. The free energy released in this process is used to form the high-energy compounds ATP (adenosine triphosphate) and NADH (reduced nicotinamide adenine dinucleotide). [Glycolysis. Wikipedia]
This biochemical diagram was redesigned using ConceptDraw PRO diagramming and vector drawing software from Wikimedia file Glycolysis overview.svg [https:/ / commons.wikimedia.org/ wiki/ File:Glycolysis_ overview.svg].
This biochemistry diagram example is included in the Biology solution from the Science and Education area of ConceptDraw Solution Park. www.conceptdraw.com/ solution-park/ science-education-biology
Page1
- Biochemical metabolic pathway map diagram | Biochemical ...
- Business Diagram Software | Glucose catabolism pathways map ...
- Design elements - Biochemistry of metabolism | Biochemical ...
- Biochemical pathway map - Key metabolic processes | Design ...
- Glucose catabolism pathways map | Catabolism schematic ...
- Glycolysis overview diagram | Catabolism schematic | Glucose ...
- Glucose catabolism pathways map
- Biochemical metabolic pathway map diagram | Catabolism schematic |
- How To Share Presentation via Skype | Biochemical metabolic ...
- Glucose catabolism pathways map |
- Physics | Language Learning | Mathematics |
- Chemical and Process Engineering | Engineering | Chemistry |
- Business Diagram Software | Physics | How To Make a Bubble Chart |
- Mathematics | Science and Education Area | Physics |
- Mind Map Exchange | Management | Social Media Response |
- Design elements - Biochemistry of metabolism | Business Diagram ...
- Chemistry | Design elements - Chemical elements | Carbonyl ...
- Biochemical pathway map - Key metabolic processes |
- Catabolism schematic | Design elements - Biochemistry of metabolism
- Biochemical pathway map - Key metabolic processes | Catabolism ...