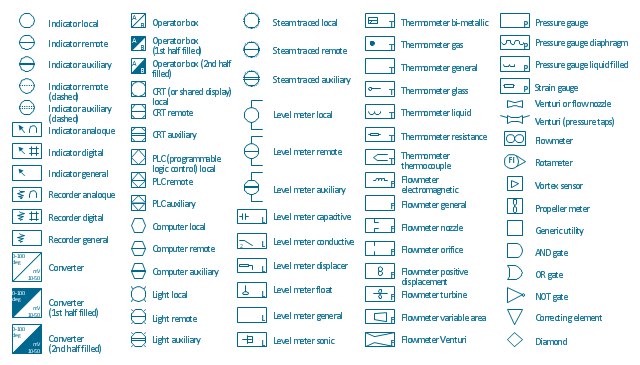
The vector stencils library "Instruments" contains 72 symbols of control instruments and measuring devices: meters and gauges, and callouts, text boxes, and inserts.
Use these shapes to create annotated process flow diagrams (PFD), flow control, manufacturing processes, and distribution system diagrams.
"Process control is an engineering discipline that deals with architectures, mechanisms and algorithms for maintaining the output of a specific process within a desired range.
Process control is extensively used in industry and enables mass production of continuous processes such as oil refining, paper manufacturing, chemicals, power plants and many other industries. Process control enables automation, with which a small staff of operating personnel can operate a complex process from a central control room." [Process control. Wikipedia]
The example "Design elements - Instruments" was created using the ConceptDraw PRO diagramming and vector drawing software extended with the Chemical and Process Engineering solution from the Engineering area of ConceptDraw Solution Park.
Process control instrument symbols
Electrical Symbols — Transistors
Network Glossary Definition


 Physics
Physics solution extends ConceptDraw DIAGRAM software with templates, samples and libraries of vector stencils for drawing the physical illustrations, diagrams and charts.
 Chemistry
This solution extends ConceptDraw DIAGRAM software with samples, template and libraries of vector stencils for drawing the Chemistry Illustrations for science and education.
 Astronomy
Astronomy solution extends ConceptDraw DIAGRAM software with illustration and sketching software with templates, samples and libraries of a variety of astronomy symbols, including constellations, galaxies, stars, and planet vector shapes; a whole host of cele
 USA Maps
Use the USA Maps solution to create a map of USA, a US interstate map, printable US maps, US maps with cities and US maps with capitals. Create a complete USA states map.
 Azure Architecture
Azure Architecture solution bundles into one handy tool everything you need to create effective Azure Architecture diagrams. It adds the extra value to versatile ConceptDraw DIAGRAM software and extends the users capabilities with comprehensive collection of Microsoft Azure themed graphics, logos, preset templates, wide array of predesigned vector symbols that covers the subjects such as Azure management, Azure storage, and Azure services, amongst others, and allow you to illustrate Azure Architecture diagrams at any degree of complexity, to present visually your Azure cloud system architecture with professional style, to design Azure cloud topology, to document Windows Azure Architecture and Azure Cloud System Architecture, to visualize the great abilities and work of Microsoft Azure Cloud System and Azure services.
 Biomedicine
Biomedicine solution extends ConceptDraw DIAGRAM ector diagramming software with abundance of samples and libraries of vector biomedical icons, pictograms of biomedical sciences and biomedical technologies, the main purpose of which is to help biomedical doctors, biomedical researchers, scientific professionals, professors in biomedical science, technicians, lectors, students to describe visually and to illustrate new achievements and new technologies in biomedical science, results of experiments and tests at this field, to depict the history of biomedicine development, the stages and progress at this field, to plan future biomedicine technologies and to describe those that are now in development or on the stage of testing the biomedical technology by biomedical specialists, to design colorful and professionally looking illustrations, diagrams, presentation slides and infographics in fields of biomedicine, personalized medicine, regenerative medicine, molecular medicine, evidence-based medicine, reconstructive biomedicine, and preventive health care.
 macOS User Interface
macOS User Interface solution extends the ConceptDraw DIAGRAM functionality with powerful GUI software graphic design features and tools. It provides an extensive range of multifarious macOS Sierra user interface design examples, samples and templates, and wide variety of libraries, containing a lot of pre-designed vector objects of Mac Apps icons, buttons, dialogs, menu bars, indicators, pointers, controls, toolbars, menus, and other elements for fast and simple designing high standard user interfaces of any complexity for new macOS Sierra.