Flowchart Example: Flow Chart of Marketing Analysis
An example flowchart of marketing analysis shows main steps you have to challenge writing a marketing analysis.Marketing Analysis Diagram
An example of marketing analysis diagram, can be used to analyse product market and define marketing strategy. This types of charts used by small business project management for making presentations on market shares, it used by marketing project management software and project management tracking tools for reporting results and statuses.HelpDesk
How to Draw a Circular Arrows Diagram Using ConceptDraw PRO
The cyclic recurrence is a fundamental property of multiple systems. The cycle is a process which consists from elements (phases, stages, stages) following each other. Many processes in astronomy, biology, chemistry, physics, mathematics, etc. have a cycle properties. It is also widely used in information technologies and marketing analysis. Graphical representation of cyclic processes can have many forms. It can be a circle, parabola, hyperbola, ellipse and others. A Circular Arrows Diagram is used as one of the statistical charts in the business, mass media and marketing. ConceptDraw PRO provides its users tools for making easy drawing Circular Arrows Diagrams.SWOT Analysis
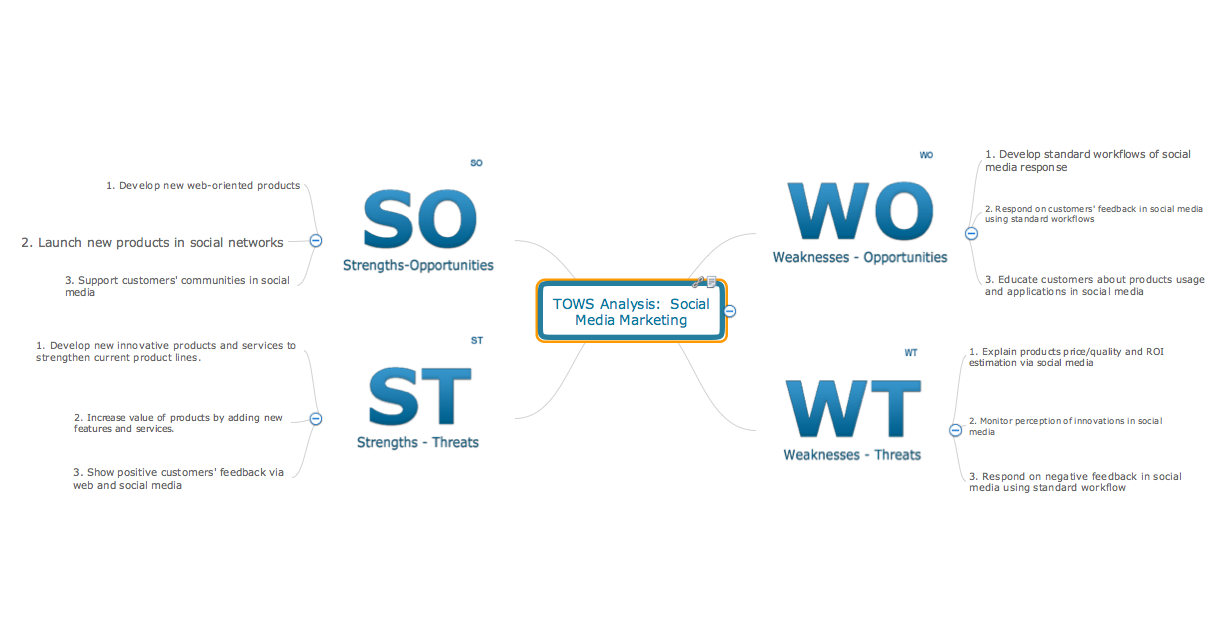
Using mind mapping to define Strengths, Weaknesses/Limitations, Opportunities, and Threats is a natural fit. SWOT mind maps quickly capture your ideas, and allow you to add and subtract easily, ensuring you don’t overlook any important items.- Flow Chart of Marketing Analysis
- Marketing Analysis Diagram | Flowchart Example: Flow Chart of ...
- Flowchart Example: Flow Chart of Marketing Analysis | Process ...
- Marketing Analysis Diagram | Marketing Organization Chart ...
- Marketing Diagrams | Marketing Analysis Diagram | Marketing ...
- Flowchart Example: Flow Chart of Marketing Analysis | Scatter Chart ...
- Marketing Analysis Diagram | Flowchart Example: Flow Chart of ...
- Design elements - Marketing charts | Marketing Analysis Diagram ...
- Marketing Charts | Market Chart | Marketing Analysis Diagram ...
- Flowchart Marketing Process. Flowchart Examples | Flowchart ...
- How To Use Enterprise Collaboration Software | Marketing Analysis ...
- Flowchart Marketing Process. Flowchart Examples | Flowchart ...
- Process Flowchart | Flowchart Example: Flow Chart of Marketing ...
- Flowchart Example: Flow Chart of Marketing Analysis | Social Media ...
- Flowchart Example: Flow Chart of Marketing Analysis
- Flowchart Example: Flow Chart of Marketing Analysis | Flow chart ...
- Flowchart Example: Flow Chart of Marketing Analysis | Flow chart ...
- Flowchart Example: Flow Chart of Marketing Analysis | Social Media ...
- Marketing Analysis Diagram | Marketing | Mind Maps for Business ...
- Marketing Diagrams | Marketing Analysis Diagram | Marketing mix ...


