 ConceptDraw Solution Park
ConceptDraw Solution Park collects graphic extensions, examples and learning materials
 Venn Diagrams
Venn Diagrams are actively used to illustrate simple set relationships in set theory and probability theory, logic and statistics, mathematics and computer science, linguistics, sociology, and marketing. Venn Diagrams are also often used to visually summarize the status and future viability of a project.
HelpDesk
How to Create a Venn Diagram in ConceptDraw PRO
Venn diagrams were invented by John Venn as a method of depicting relationships between different components. A Venn diagram consists of two or more circles. Each circle represents a specific group or set. The entities which are depicted by circles generally have some common characteristics. A Venn Diagram shows all the possible logical relations between these entities. Any properties that belong to more than one set should be indicated in the sections where the circles overlap. A Venn Diagram can be useful to visually summarize the status and future viability of a project. ConceptDraw PRO allows you to make a Venn diagrams using the Venn Diagrams solution.HelpDesk
How to Make Soccer Position Diagram Using ConceptDraw PRO
The soccer field has the form of a large rectangle, covered with grass. Dimensions of soccer fields may vary slightly, depending on the level of the game, but all fields have some common characteristics. Soccer players may take different positions. Each soccer position has its own name, and implies certain player functions. Every soccer position has a very specific name and task: Goalkeeper, Defenders, Midfielders and Forwards. During preparation for the game coach met a challenge: how to explain each player's position and his role in the game. The difficulty is the fact that in the course of the game players will often move on the field and do not stay in one place. Football field diagram with dimensions and marking, and positions - it is an important tool for the coach. ConceptDraw PRO helps both coach and players to understand exactly their roles during the particular game. The ability to create Soccer diagrams is contained in the ConceptDraw Soccer solution. The solution providesHelpDesk
How to Add a Block Diagram to a PowerPoint Presentation Using ConceptDraw PRO
A block diagram is a useful tool both in designing new processes, and in improving existing. A block diagram is a type of chart, which is often used in presentations, because of its universality - the graphic blocks can be applied to many processes.The PowerPoint presentation of major process steps and key process participants can be very informative and helpful. Using ConceptDraw PRO, you can easily convert a block diagram to MS PowerPoint presentation.HelpDesk
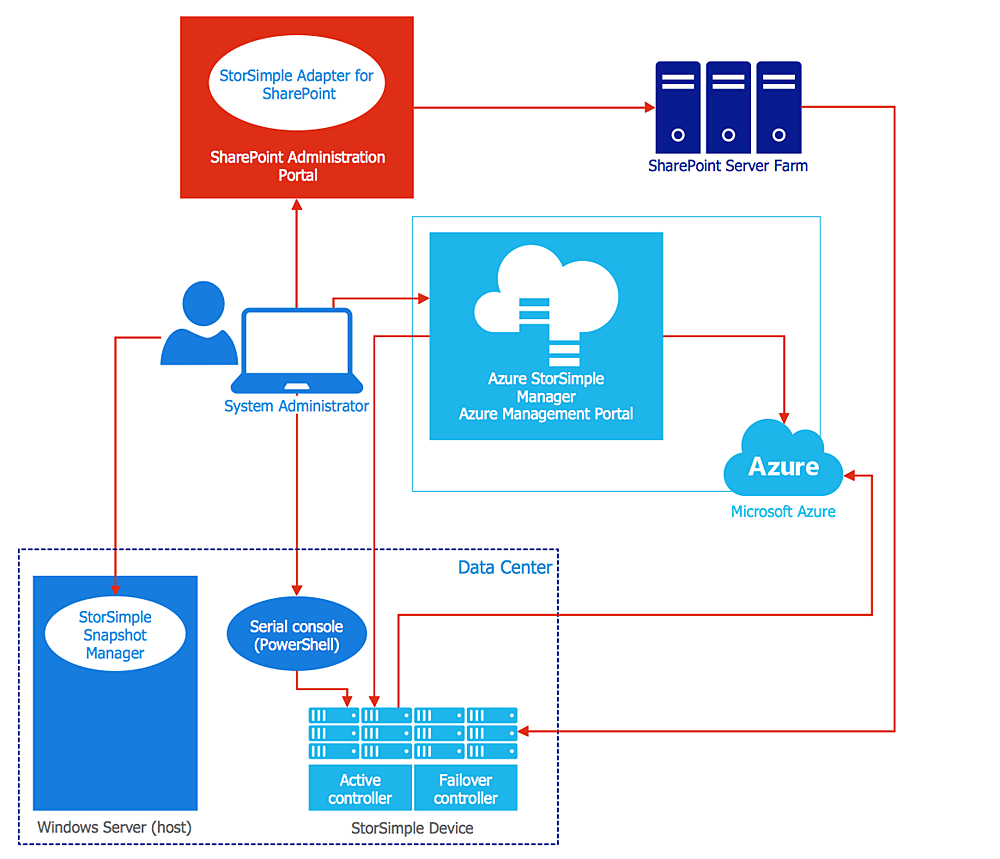
How to Create an Azure Architecture Diagram Using ConceptDraw PRO
Microsoft Azure is an open cloud computing platform, designed by Microsoft. It provides the ability to develop and launch applications and to store data on servers in distributed data centers. Microsoft Azure cloud offers two models - platform as a service (PaaS) and infrastructure as a service (IaaS). The efficiency of the Windows Azure platform is supported by a global network of Microsoft data centers. Developers use Azure Architecture diagrams to visualize and document the architecture of applications bases on Microsoft Azure services. Using the ConceptDraw Azure Architecture solution makes much easier the work on documenting the Microsoft Azure architecture.- Internet Marketing Infographic | Internet marketing - Concept map ...
- ConceptDraw Solution Park | Concept Maps | Venn Diagrams ...
- Create Context Diagram Online
- Online Software To Draw Segmented Cycle Diagram
- Online Marketing Chart Diagram
- Make A Diagram Online
- Make Diagram Online
- Store Layout Software | State Diagram Example - Online Store | CAD ...
- Activity Diagram Web Customer Uses Some Site To Make
- Venn Diagrams | Venn Diagram | How to Create a Venn Diagram in ...
- Make Statistical Graphs Online
- Make Er Diagram Online
- Best Diagramming Software for Mac | Venn Diagram Examples for ...
- UML Component Diagram Example - Online Shopping | UML ...
- Process Flowchart | Venn Diagram Examples for Problem Solving ...
- Concept Maps | Venn diagram - Internet marketing professions ...
- Draw Uml Diagram Online
- UML Component Diagram Example - Online Shopping | State ...
- UML Component Diagram Example - Online Shopping
- Online Decision Making Process Block Diagrams


