Cross Functional Flowchart Examples

How to Draw a Flowchart

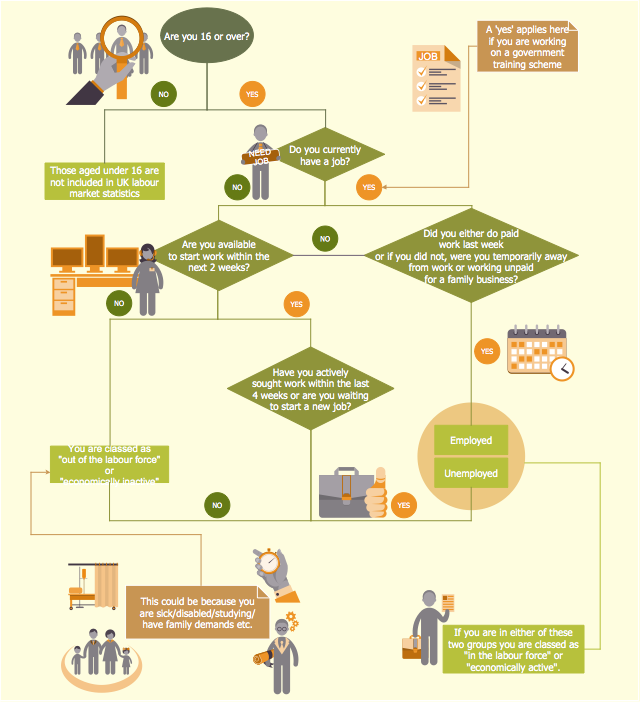
HR flowchart "UK Labour Market Categories" was redesigned from the Wikipedia file: UK Labour Market Categories.png.
"Flow chart showing the different categories in the UK labour market such as employed, unemployed and economically inactive." [commons.wikimedia.org/ wiki/ File:UK_ Labour_ Market_ Categories.png]
This file is licensed under the Creative Commons Attribution-Share Alike 3.0 Unported license. [creativecommons.org/ licenses/ by-sa/ 3.0/ ]
"Employment is a relationship between two parties, usually based on a contract, one being the employer and the other being the employee. ...
An employee contributes labor and expertise to an endeavor of an employer and is usually hired to perform specific duties which are packaged into a job. An Employee is a person who is hired to provide services to a company on a regular basis in exchange for compensation and who does not provide these services as part of an independent business. ...
Employer and managerial control within an organization rests at many levels and has important implications for staff and productivity alike, with control forming the fundamental link between desired outcomes and actual processes. Employers must balance interests such as decreasing wage constraints with a maximization of labor productivity in order to achieve a profitable and productive employment relationship." [Employment. Wikipedia]
The HR flow chart example "UK labour market categories" was created using the ConceptDraw PRO diagramming and vector drawing software extended with the HR Flowcharts solution from the Management area of ConceptDraw Solution Park.
HR flowchart

How To use House Electrical Plan Software


Website Wireframe

 Fishbone Diagrams
The Fishbone Diagrams solution extends ConceptDraw PRO v10 software with the ability to easily draw the Fishbone Diagrams (Ishikawa Diagrams) to clearly see the cause and effect analysis and also problem solving. The vector graphic diagrams produced using this solution can be used in whitepapers, presentations, datasheets, posters, and published technical material.
 Business Process Diagrams
Business Process Diagrams solution extends the ConceptDraw PRO BPM software with RapidDraw interface, templates, samples and numerous libraries based on the BPMN 1.2 and BPMN 2.0 standards, which give you the possibility to visualize equally easy simple and complex processes, to design business models, to quickly develop and document in details any business processes on the stages of project’s planning and implementation.
- Firefighter Logo Vector
- USA Maps | Wireframe GUI - Template | Website Wireframe ...
- Swim Lane Flowchart Symbols | How to Create a BPMN Diagram ...
- iPhone User Interface | Wireframe GUI - Template | Azure ...
- Business Process Diagrams | Business Process Modeling Notation ...
- Fire safety equipment - Vector stencils library | Fire fighting and fire ...
- Wireframe GUI - Template | Wireframe Examples | How to Design an ...
- BPMN 2.0 | Process Flowchart | How to Create a BPMN Diagram ...
- How to Create a BPMN Diagram Using ConceptDraw PRO | Design ...
- Fire fighting and fire protection equipment | Fire safety equipment ...