HelpDesk
How to Connect Text Data to a Time Series Chart on Your Live Dashboard


"A call centre or call center is a centralised office used for the purpose of receiving or transmitting a large volume of requests by telephone. An inbound call centre is operated by a company to administer incoming product support or information inquiries from consumers. Outbound call centers are operated for telemarketing, solicitation of charitable or political donations, debt collection and market research. In addition to a call centre, collective handling of letter, fax, live support software,social media and e-mail at one location is known as a contact centre.
A call centre is operated through an extensive open workspace for call centre agents, with work stations that include a computer for each agent, a telephone set or headset connected to a telecom switch, and one or more supervisor stations. It can be independently operated or networked with additional centres, often linked to a corporate computer network, including mainframes, microcomputers and LANs. Increasingly, the voice and data pathways into the centre are linked through a set of new technologies called computer telephony integration (CTI)." [Call centre. Wikipedia]
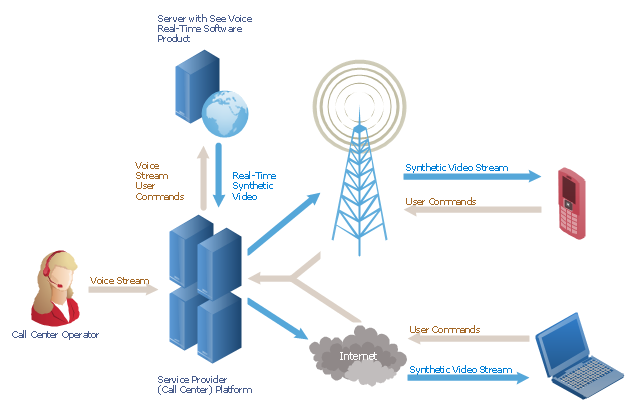
This call center network diagram example was created using the ConceptDraw PRO diagramming and vector drawing software extended with the Telecommunication Network Diagrams solution from the Computer and Networks area of ConceptDraw Solution Park.
A call centre is operated through an extensive open workspace for call centre agents, with work stations that include a computer for each agent, a telephone set or headset connected to a telecom switch, and one or more supervisor stations. It can be independently operated or networked with additional centres, often linked to a corporate computer network, including mainframes, microcomputers and LANs. Increasingly, the voice and data pathways into the centre are linked through a set of new technologies called computer telephony integration (CTI)." [Call centre. Wikipedia]
This call center network diagram example was created using the ConceptDraw PRO diagramming and vector drawing software extended with the Telecommunication Network Diagrams solution from the Computer and Networks area of ConceptDraw Solution Park.
Network scheme
Interactive Voice Response Network Diagram


- Entity Relationship Diagram Data Model
- Entity Relationship Diagram Symbols and Meaning ERD Symbols ...
- ConceptDraw PRO Database Modeling Software | Database ...
- Gane Sarson Diagram | Data Flow Diagram Process | DFD Library ...
- Data Flow Diagram Symbols. DFD Library | Entity Relationship ...
- ConceptDraw PRO Database Modeling Software | Data Modeling ...
- Design elements - ERD (crow's foot notation) | Entity Relationship ...
- Data Flow Diagrams | Entity Relationship Diagram Symbols and ...
- ER Diagram Programs for Mac | Entity Relationship Diagram ...
- Entity-Relationship Diagram
- Process Flowchart | Data structure diagram with ConceptDraw PRO ...
- Entity Relationship Diagram Software for Mac | Entity-Relationship ...
- Entity Relationship Diagram Symbols | Basic Flowchart Symbols and ...
- Entity Relationship Diagram Chen Model
- Entity Relationship Diagram Symbols and Meaning ERD Symbols ...
- Call center network diagram | Trouble ticket system - BPMN 2.0 ...
- Entity Relationship Diagram Examples
- Data Flow Diagrams
- WordPress file-reference ERD | Design elements - ERD (crow's foot ...
- Components of ER Diagram | Entity Relationship Diagram Symbols ...