Line Chart Template for Word

This line graph templates shows the number of tourists visiting the resort town for six months. Use it to design your time series line charts in ConceptDraw PRO diagramming and vector drawing software.
"A time series is a sequence of data points, measured typically at successive points in time spaced at uniform time intervals. ... Time series are very frequently plotted via line charts. Time series are used in statistics, signal processing, pattern recognition, econometrics, mathematical finance, weather forecasting, earthquake prediction, electroencephalography, control engineering, astronomy, and communications engineering. Time series analysis comprises methods for analyzing time series data in order to extract meaningful statistics and other characteristics of the data. Time series forecasting is the use of a model to predict future values based on previously observed values. While regression analysis is often employed in such a way as to test theories that the current values of one or more independent time series affect the current value of another time series, this type of analysis of time series is not called "time series analysis", which focuses on comparing values of time series at different points in time. Time series data have a natural temporal ordering." [Time series. Wikipedia]
The chart template "Line graph" is included in the Basic Line Graphs solution from the Graphs and Charts area of ConceptDraw Solution Park.
Chart template
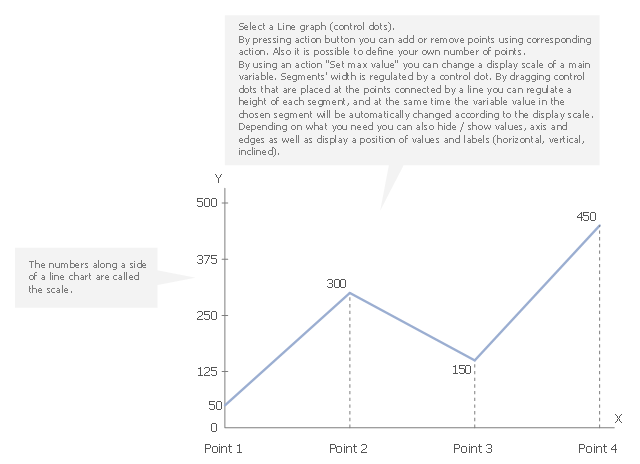
Chart Templates

Use this template to design your line graphs.
"A time series is a sequence of data points, measured typically at successive points in time spaced at uniform time intervals. ... Time series are very frequently plotted via line charts. Time series are used in statistics, signal processing, pattern recognition, econometrics, mathematical finance, weather forecasting, earthquake prediction, electroencephalography, control engineering, astronomy, and communications engineering. Time series analysis comprises methods for analyzing time series data in order to extract meaningful statistics and other characteristics of the data. Time series forecasting is the use of a model to predict future values based on previously observed values. While regression analysis is often employed in such a way as to test theories that the current values of one or more independent time series affect the current value of another time series, this type of analysis of time series is not called "time series analysis", which focuses on comparing values of time series at different points in time. Time series data have a natural temporal ordering." [Time series. Wikipedia]
The line graph template for the ConceptDraw PRO diagramming and vector drawing software is included in the Line Graphs solution from the Graphs and Charts area of ConceptDraw Solution Park.
Template
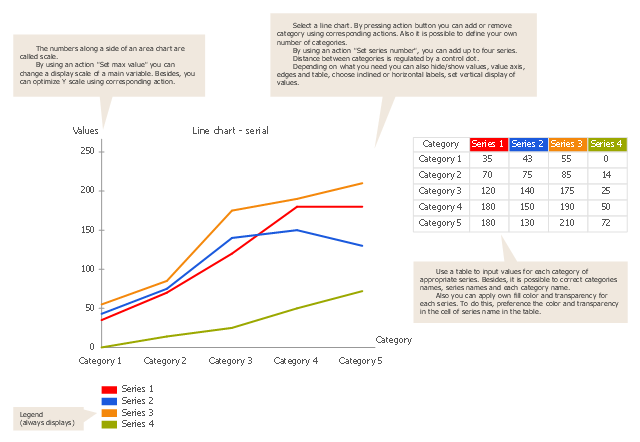
Chart Maker for Presentations

Line Chart Examples

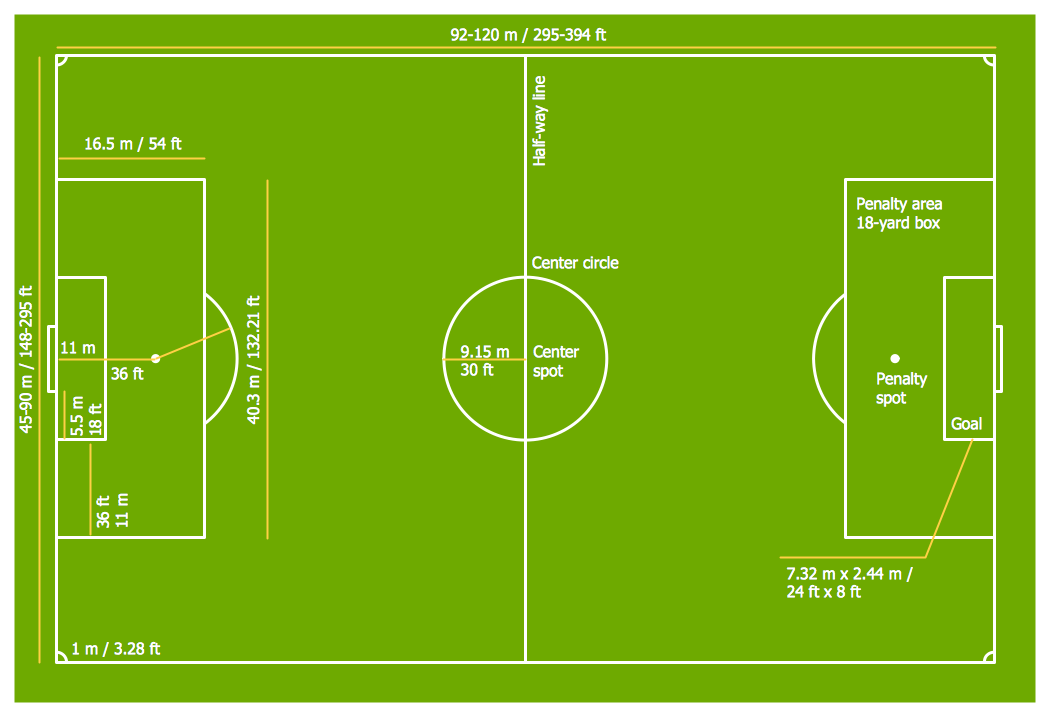
Soccer (Football) Field Templates
Bar Chart Template for Word

 Line Graphs
How to draw a Line Graph with ease? The Line Graphs solution extends the capabilities of ConceptDraw DIAGRAM with professionally designed templates, samples, and a library of vector stencils for drawing perfect Line Graphs.
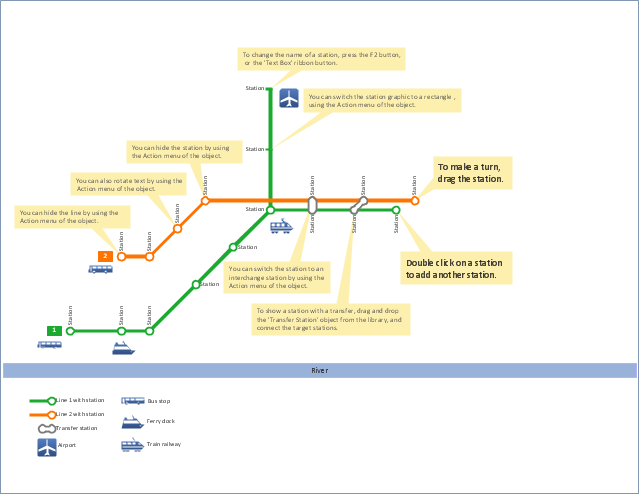
"A transit map is a topological map in the form of a schematic diagram used to illustrate the routes and stations within a public transport system - whether this be bus lines, tramways, rapid transit, commuter rail or ferry routes. The main components are color coded lines to indicate each line or service, with named icons to indicate stations or stops.
Transit maps can be found in the transit vehicles, at the platforms or in printed timetables. Their primary function is to help users to efficiently use the public transport system, including which stations function as interchange between lines. Unlike conventional maps, transit maps are usually not geographically accurate - instead they use straight lines and fixed angles, and often illustrate a fixed distance between stations, compressing those in the outer area of the system and expanding those close to the center." [Transit map. Wikipedia]
This transit map template for the ConceptDraw PRO diagramming and vector drawing software is included in the Metro Map solution from the Maps area of ConceptDraw Solution Park.
www.conceptdraw.com/ solution-park/ maps-metro-map
Transit map
- Line graph - Template
- Line Chart Examples | Line Chart Template for Word | How to Draw ...
- Line Chart Template for Word
- Line Graph Templates
- Line Chart Template for Word | How to Create Presentation of Your ...
- Ice Hockey Rink Dimensions | Hockey rink - Template | Distance ...
- Examples Of Line Graph Templates
- Basic Diagramming | Line Chart Template for Word | How to Create ...
- Line Chart Template for Word | Chart Maker for Presentations ...
- Line Chart | Line Chart Templates | Line Chart Examples | Time ...