ConceptDraw DIAGRAM Compatibility with MS Visio

HelpDesk
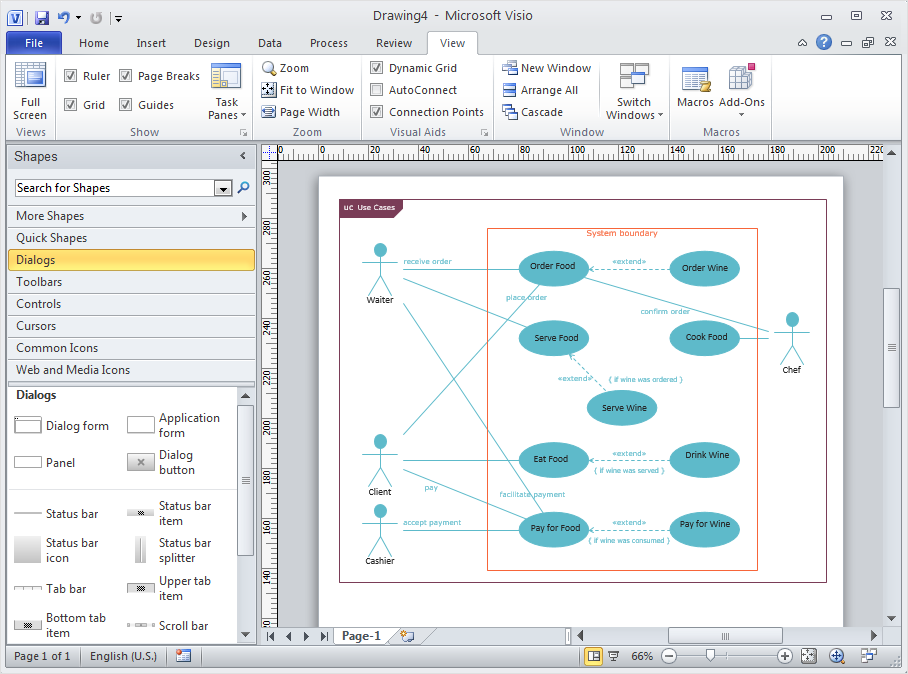
How to Convert ConceptDraw DIAGRAM v12 file into MS Visio 2003-2010 format
 Office Layout Plans
Office layouts and office plans are a special category of building plans and are often an obligatory requirement for precise and correct construction, design and exploitation office premises and business buildings. Designers and architects strive to make office plans and office floor plans simple and accurate, but at the same time unique, elegant, creative, and even extraordinary to easily increase the effectiveness of the work while attracting a large number of clients.
HelpDesk
How to Draw a Gantt Chart

 Business Process Diagrams
Business Process Diagrams solution extends the ConceptDraw DIAGRAM BPM software with RapidDraw interface, templates, samples and numerous libraries based on the BPMN 1.2 and BPMN 2.0 standards, which give you the possibility to visualize equally easy simple and complex processes, to design business models, to quickly develop and document in details any business processes on the stages of project’s planning and implementation.
 Presentation Clipart
Presentation design elements solution extends ConceptDraw DIAGRAM software with slide samples, templates and vector stencils libraries with design elements of presentation symbols, arrows, callouts, backgrounds, borders and frames, title blocks.
 IDEF0 Diagrams
IDEF0 Diagrams visualize system models using the Integration Definition for Function Modeling (IDEF) methodology. Use them for analysis, development and integration of information and software systems, and business process modelling.
 Active Directory Diagrams
Active Directory Diagrams solution significantly extends the capabilities of ConceptDraw DIAGRAM software with special Active Directory samples, convenient template and libraries of Active Directory vector stencils, common icons of sites and services, icons of LDPA elements, which were developed to help you in planning and modelling network structures and network topologies, in designing excellently looking Active Directory diagrams, Active Directory Structure diagrams, and Active Directory Services diagram, which are perfect way to visualize detailed structures of Microsoft Windows networks, Active Directory Domain topology, Active Directory Site topology, Organizational Units (OU), and Exchange Server organization.
HelpDesk
How to Create a Timeline Diagram

 AWS Architecture Diagrams
AWS Architecture Diagrams with powerful drawing tools and numerous predesigned Amazon icons and AWS simple icons is the best for creation the AWS Architecture Diagrams, describing the use of Amazon Web Services or Amazon Cloud Services, their application for development and implementation the systems running on the AWS infrastructure. The multifarious samples give you the good understanding of AWS platform, its structure, services, resources and features, wide opportunities, advantages and benefits from their use; solution’s templates are essential and helpful when designing, description and implementing the AWS infrastructure-based systems. Use them in technical documentation, advertising and marketing materials, in specifications, presentation slides, whitepapers, datasheets, posters, etc.
 Spatial Infographics
Spatial infographics solution extends ConceptDraw DIAGRAM software with infographic samples, map templates and vector stencils libraries with design elements for drawing spatial information graphics.
- How To use Landscape Design Software
- Design elements - Geography | How to Draw a Natural Landscape ...
- How To use Landscape Design Software | How To Draw Building ...
- Landscape Architecture with ConceptDraw PRO | How To Create ...
- Design elements - Geography | Geography - Vector stencils library ...
- Diagramming Software for Design UML Object Diagrams ...
- Landscape Architecture with ConceptDraw PRO | Computer ...
- Process Flowchart | Types of Flowchart - Overview | How to Design a ...
- Computer Network Architecture. Computer and Network Examples ...
- Process Flowchart | Basic Flowchart Symbols and Meaning | Bubble ...
- Building Drawing Software for Design Site Plan | Interior Design Site ...
- How to Open MS Visio® 2013/2016 Files on a Mac® Using ...
- How to Open MS Visio® 2013/2016 Files on a Mac® Using ...
- Universal Diagramming Area | Maps | How to Draw a Natural ...
- How can you illustrate the weather condition | Nature | Design ...
- Map Infographic Maker | Sign Making Software | Entity-Relationship ...
- SWOT Analysis | SWOT and TOWS Matrix Diagrams | How to Make ...
- Landscape Design Palm Tree Drawing
- Design elements - Trees and plants | Trees and plants - Vector ...