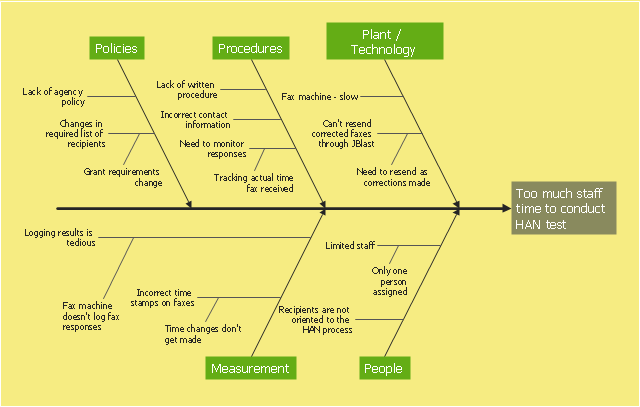
This example was created on the base of the figure from the website of Minnesota Department of Health. [health.state.mn.us/ divs/ opi/ qi/ images/ fishbone_ ex.png]
"Minnesota’s Health Alert Network (HAN) enables public health staff, tribal governments, health care providers, emergency workers, and others working to protect the public to exchange information during a disease outbreak, environmental threat, natural disaster, or act of terrorism." [health.state.mn.us/ han/ ]
The fishbone diagram example "HAN project" was created using the ConceptDraw PRO diagramming and vector drawing software extended with the Fishbone Diagrams solution from the Management area of ConceptDraw Solution Park.
TQM Diagram — Professional Total Quality Management
The Total Quality Management Diagram solution helps you and your organization visualize business and industrial processes. Create Total Quality Management diagrams for business process with ConceptDraw software.PROBLEM ANALYSIS. Root Cause Analysis Tree Diagram
Root Cause Analysis Tree Diagram. Use the Root Cause Diagram to perform visual root cause analysis. Root Cause Analysis Tree Diagram is constructed separately for each highly prioritized factor. The goal of this is to find the root causes for the factor and list possible corrective action. ConceptDraw Office suite is a software for problem analysis.
- Cause And Effect Diagram Examples In Healthcare
- Design elements - Cause-and- effect diagram | Fishbone diagram ...
- Fishbone Diagrams In Healthcare
- Fishbone diagram - Template | Design elements - Cause-and- effect ...
- Fishbone Diagram | Fishbone diagram - HAN project | Fishbone ...
- Total Quality Management with ConceptDraw | Design elements ...
- Cause And Effect Diagram Pdf
- Diagram Of Health Management
- Relations diagram - Health care | PROBLEM ANALYSIS. Relations ...
- Fishbone diagram - HAN project | Ishikawa Disease
- Cause And Effect Analysis Example
- Fishbone Diagram | Fishbone Diagram Example | Cause and Effect ...
- Eexample Of A Disease For Cause And Effect Charts
- Fishbone Diagrams | How to Draw a Fishbone Diagram with ...
- Fishbone Diagram | Fishbone Diagram Example | Using Fishbone ...
- Using Fishbone Diagrams for Problem Solving | Relations diagram ...
- Fishbone Diagram | Fishbone Diagram Example | Fishbone ...
- Cause and Effect Diagrams | When To Use a Fishbone Diagram ...
- Draw Fishbone Diagram on MAC Software | Create Fishbone ...
- Draw Fishbone Diagram on MAC Software | Fishbone Diagram ...


