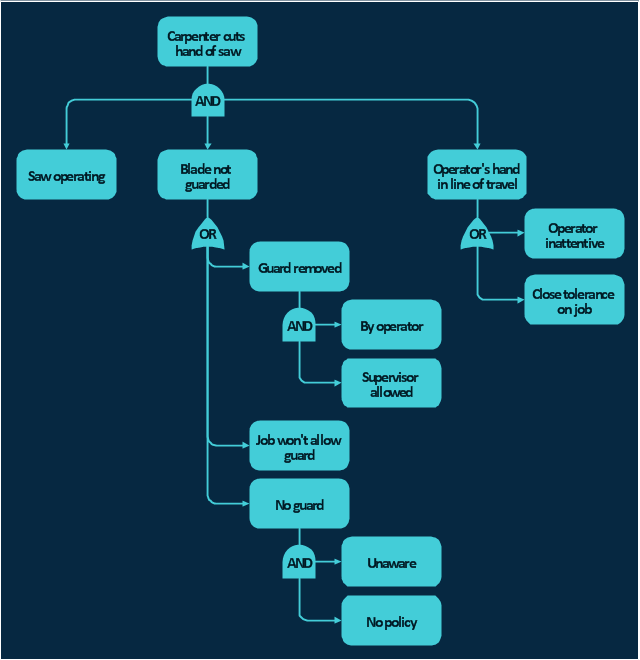
The FTA diagram example "Hazard analysis" was redesigned from the illustration of the article "Hazard Analysis Methodologies" from the Occupational Safety & Health Administration (OSHA) website.
"A fault tree analysis is a quantitative assessment of all of the undesirable outcomes, such as a toxic gas release or explosion, which could result from a specific initiating event. It begins with a graphic representation (using logic symbols) of all possible sequences of events that could result in an incident. The resulting diagram looks like a tree with many branches — each branch listing the sequential events (failures) for different independent paths to the top event. Probabilities (using failure rate data) are assigned to each event and then used to calculate the probability of occurrence of the undesired event. ...
This technique is particularly useful in evaluating the effect of alternative actions on reducing the probability of occurrence of the undesired event."
[osha.gov/ SLTC/ etools/ safetyhealth/ mod4_ tools_ methodologies.html]
The FTA diagram example "Hazard analysis" was created using the ConceptDraw PRO diagramming and vector drawing software extended with the Fault Tree Analysis Diagrams solution from the Engineering area of ConceptDraw Solution Park.
FTA diagram
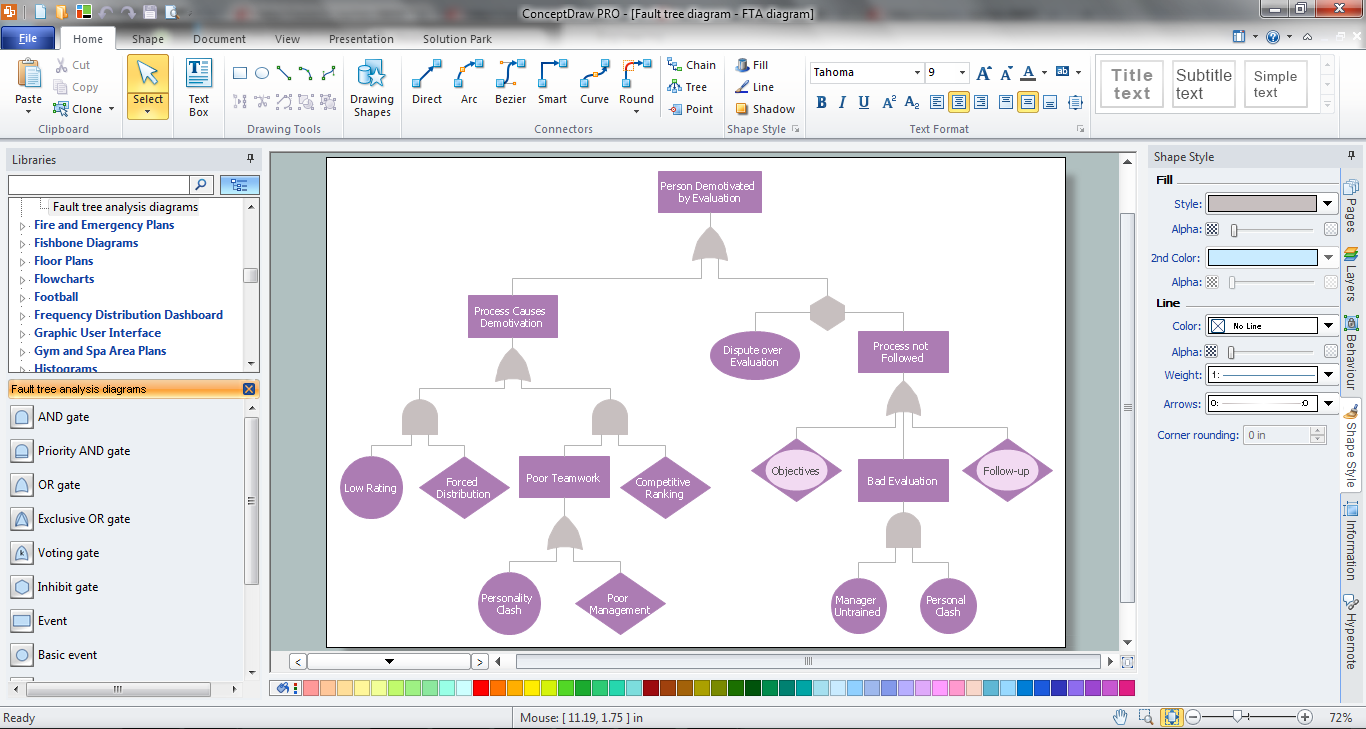
Fault Tree Analysis Software
This example was redesigned from the Wikimedia Commons file: Example of High Level Fault Tree.jpg. [commons.wikimedia.org/ wiki/ File:Example_ of_ High_ Level_ Fault_ Tree.jpg]
"Risk assessment is the determination of quantitative or qualitative value of risk related to a concrete situation and a recognized threat (also called hazard). Quantitative risk assessment requires calculations of two components of risk (R):, the magnitude of the potential loss (L), and the probability (p) that the loss will occur. Acceptable risk is a risk that is understood and tolerated usually because the cost or difficulty of implementing an effective countermeasure for the associated vulnerability exceeds the expectation of loss.
In all types of engineering of complex systems sophisticated risk assessments are often made within Safety engineering and Reliability engineering when it concerns threats to life, environment or machine functioning. The nuclear, aerospace, oil, rail and military industries have a long history of dealing with risk assessment. Also, medical, hospital, social service and food industries control risks and perform risk assessments on a continual basis. Methods for assessment of risk may differ between industries and whether it pertains to general financial decisions or environmental, ecological, or public health risk assessment." [Risk assessment. Wikipedia]
The FTA diagram example "High level fault tree" was created using the ConceptDraw PRO diagramming and vector drawing software extended with the Fault Tree Analysis Diagrams solution from the Engineering area of ConceptDraw Solution Park.
FTA diagram

The accident analysis diagram example "Accident analytic tree" was redesigned from the picture 7-14 from the "DOE Workbook. Conducting Accident Investigations. Revision 2."
"Analytic tree analyses are well defined, useful methods that graphically depict, from beginning to end, the events and conditions preceding and immediately following an accident. An analytic tree is a means of organizing information that helps the investigator conduct a deductive analysis of any system (human, equipment, or environmental) to determine critical paths of success and failure. Results from this analysis identify the details and interrelationships that must be considered to prevent the oversights, errors, and omissions that lead to failures. In accident investigations, this type of analysis can consist of both failure paths and success paths, and can lead to neutral, negative, or positive conclusions regarding accident severity.
TIP.
An analytic tree enables the user to:
(1) Systematically identify the possible paths from events to outcome.
(2) Display a graphical record of the analytical process.
(3) Identify management system weaknesses and strengths."
[homer.ornl.gov/ sesa/ corporatesafety/ aip/ docs/ workbook/ Rev2/ chpt7/ chapt7.htm]
The FTA diagram example "Accident analytic tree" was created using the ConceptDraw PRO diagramming and vector drawing software extended with the Fault Tree Analysis Diagrams solution from the Engineering area of ConceptDraw Solution Park.
FTA diagram

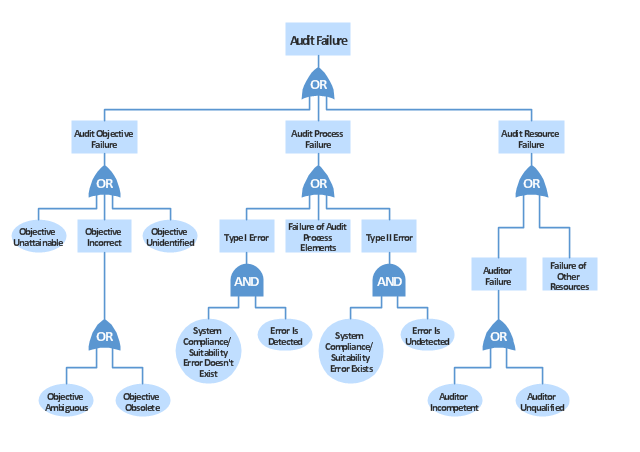
"Failure analysis is the process of collecting and analyzing data to determine the cause of a failure. It is an important discipline in many branches of manufacturing industry, such as the electronics industry, where it is a vital tool used in the development of new products and for the improvement of existing products. There are many companies which provide services to find the cause of failure in products, devices and in post disaster situations. The failure analysis process relies on collecting failed components for subsequent examination of the cause or causes of failure using a wide array of methods, especially microscopy and spectroscopy. The NDT or nondestructive testing methods (such as Industrial computed tomography scanning) are valuable because the failed products are unaffected by analysis, so inspection always starts using these methods." [Failure analysis. Wikipedia]
The example "Audit failure - Fault tree analysis diagram" was created using the ConceptDraw PRO diagramming and vector drawing software extended with the Fault Tree Analysis Diagrams solution from the Engineering area of ConceptDraw Solution Park.
The example "Audit failure - Fault tree analysis diagram" was created using the ConceptDraw PRO diagramming and vector drawing software extended with the Fault Tree Analysis Diagrams solution from the Engineering area of ConceptDraw Solution Park.
FTA diagram
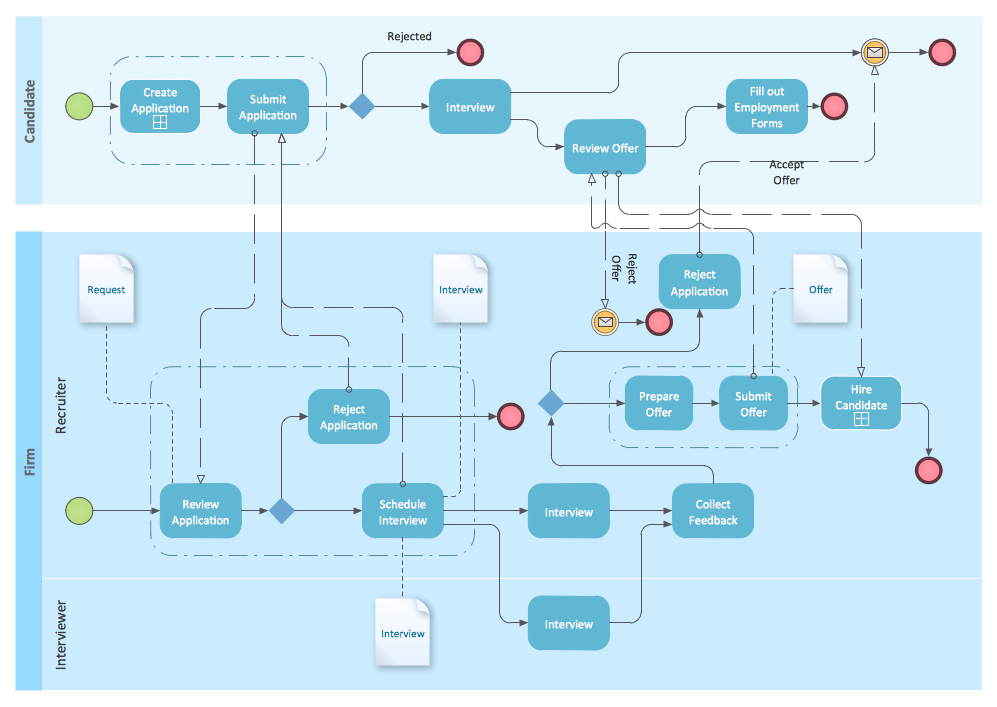
BPMN
 Business Package for Management
Package intended for professional who designing and documenting business processes, preparing business reports, plan projects and manage projects, manage organizational changes, prepare operational instructions, supervising specific department of an organization, workout customer service processes and prepare trainings for customer service personal, carry out a variety of duties to organize business workflow.
 Business Process Diagrams
Business Process Diagrams solution extends the ConceptDraw DIAGRAM BPM software with RapidDraw interface, templates, samples and numerous libraries based on the BPMN 1.2 and BPMN 2.0 standards, which give you the possibility to visualize equally easy simple and complex processes, to design business models, to quickly develop and document in details any business processes on the stages of project’s planning and implementation.
 Fault Tree Analysis Diagrams
This solution extends ConceptDraw DIAGRAM.5 or later with templates, fault tree analysis example, samples and a library of vector design elements for drawing FTA diagrams (or negative analytical trees), cause and effect diagrams and fault tree diagrams.
 Business Process Model and Notation
Business Process Model and Notation Solution for ConceptDraw DIAGRAM is helpful for modeling the business processes of any degree of complexity, documenting them and effective creating diagrams using the BPMN 2.0 standard.
- Initiating Event Definition
- FTA diagram - Hazard analysis | Accident analytic tree - FTA ...
- FTA diagram - Hazard analysis | Fault Tree Analysis Diagrams ...
- Fault Tree Analysis Diagrams | Root cause analysis tree diagram ...
- Undesired Event
- Fault Tree Analysis Software | Design elements - Fault tree analysis ...
- FTA diagram - Hazard analysis | Fta Explosion
- How to Create a Fault Tree Analysis Diagram (FTD) in ConceptDraw ...
- Transport Hazard Pictograms | FTA diagram - Hazard analysis ...
- Design elements - Events BPMN 2.0 | Design elements - Data ...