This circle-spoke diagram sample shows the structure of the Centre for Excellence in Enquiry-Based Learning (CEEBL). It was designed on the base of the hub and spoke model from the website of the University of Manchester.
"CEEBL enabled enquiry-based learning methods to be developed widely across the whole of the University of Manchester at both undergraduate and postgraduate levels.
CEEBL funded one major project in each of the four Faculties of the University (Engineering and Physical Sciences, Humanities, Life Sciences, and Medical and Human Sciences), together with a raft of smaller projects across all Faculties and in Centres based outside of Faculties.
CEEBL was structured using a ‘hub and spoke’ model — a central ‘hub’ supporting local developments through a ‘spoke’ within each Faculty."
[ceebl.manchester.ac.uk/ about/ ]
The hub and spoke diagram exampe "CEEBL structure" was created using the ConceptDraw PRO diagramming and vector drawing software extended with the Circle-Spoke Diagrams solution from the area "What is a Diagram" of ConceptDraw Solution Park.
Circle-spoke diagram

This circle-spoke diagram sample shows the Porter five forces model. It was designed on the base of the Wikimedia Commons file: Modelo Porter.png. [commons.wikimedia.org/ wiki/ File:Modelo_ Porter.png]
"Porter's five forces analysis is a framework that attempts to analyze the level of competition within an industry and business strategy development. It draws upon industrial organization (IO) economics to derive five forces that determine the competitive intensity and therefore attractiveness of an Industry. Attractiveness in this context refers to the overall industry profitability. An "unattractive" industry is one in which the combination of these five forces acts to drive down overall profitability. A very unattractive industry would be one approaching "pure competition", in which available profits for all firms are driven to normal profit. This analysis is associated with its principal innovator Michael E. Porter of Harvard University. ...
Porter's five forces include – three forces from 'horizontal' competition: the threat of substitute products or services, the threat of established rivals, and the threat of new entrants; and two forces from 'vertical' competition: the bargaining power of suppliers and the bargaining power of customers." [Porter's five forces analysis. Wikipedia]
The hub-and-spoke diagram example "Porter five forces model" was created using the ConceptDraw PRO diagramming and vector drawing software extended with the Circle-Spoke Diagrams solution from the area "What is a Diagram" of ConceptDraw Solution Park.
Circle-spoke diagram

 AWS Architecture Diagrams
AWS Architecture Diagrams with powerful drawing tools and numerous predesigned Amazon icons and AWS simple icons is the best for creation the AWS Architecture Diagrams, describing the use of Amazon Web Services or Amazon Cloud Services, their application for development and implementation the systems running on the AWS infrastructure. The multifarious samples give you the good understanding of AWS platform, its structure, services, resources and features, wide opportunities, advantages and benefits from their use; solution’s templates are essential and helpful when designing, description and implementing the AWS infrastructure-based systems. Use them in technical documentation, advertising and marketing materials, in specifications, presentation slides, whitepapers, datasheets, posters, etc.
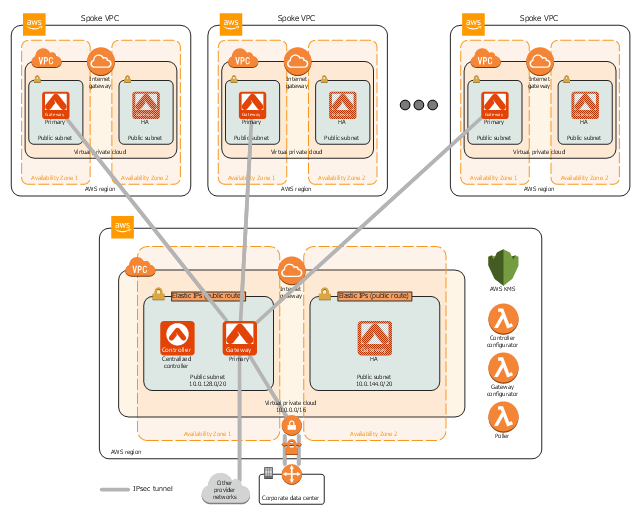
This AWS architecture diagram example shows the deployment of Aviatrix Controller and Aviatrix Gateways in a central virtual private cloud (VPC) on AWS to manage routing between remote networks (spoke VPCs) in a hub-and-spoke model. This AWS architecture sample was designed on the base of the diagram "Aviatrix Global Transit Hub on AWS" from the Amazon Web Services website. [aws.amazon.com/ ru/ quickstart/ architecture/ aviatrix-global-transit-hub/ ]
"You can add spoke VPCs to the network by tagging them in AWS. Aviatrix Global Transit Hub automatically establishes VPN connections between the spoke VPCs and the hub VPC by using AWS CloudFormation templates and AWS Lambda functions. The transit network supports multiple AWS accounts and can be extended to include shared services with direct peering, or to connect your cloud network to on-premises networks." [aws.amazon.com/ ru/ about-aws/ whats-new/ 2018/ 02/ deploy-aviatrix-global-transit-hub-on-the-aws-cloud-with-new-quick-start/ ]
The Amazon Web Services diagram example "Aviatrix Global Transit Hub on AWS" was designed using ConceptDraw PRO software extended with AWS Architecture Diagrams solution from Computer and Networks area of ConceptDraw Solution Park.
AWS architecture diagram
HelpDesk
How To Make Visio Circle-Spoke Diagram

This circle-spoke diagram sample shows the social determinants of health. It was created on the base of the hub-and-spoke diagram from the Health Canada website. [hc-sc.gc.ca/ sr-sr/ pubs/ hpr-rpms/ bull/ 2005-climat/ 2005-climat-6-eng.php]
"Social determinants of health are the economic and social conditions – and their distribution among the population – that influence individual and group differences in health status. They are risk factors found in one's living and working conditions (such as the distribution of income, wealth, influence, and power), rather than individual factors (such as behavioural risk factors or genetics) that influence the risk for a disease, or vulnerability to disease or injury. According to some viewpoints, these distributions of social determinants are shaped by public policies that reflect the influence of prevailing political ideologies of those governing a jurisdiction. ...
In 2003, the World Health Organization (WHO) Europe suggested that the social determinants of health included:
(1) Social gradients (life expectancy is shorter and disease is more common further down the social ladder).
(2) Stress (including stress in the workplace).
(3) Early childhood development.
(4) Social exclusion.
(5) Unemployment.
(6) Social support networks.
(7) Addiction.
(8) Availability of healthy food.
(9) Availability of healthy transportation." [Social determinants of health. Wikipedia]
The hub-and-spoke diagram example "Social determinants of health" was created using the ConceptDraw PRO diagramming and vector drawing software extended with the Circle-Spoke Diagrams solution from the area "What is a Diagram" of ConceptDraw Solution Park.
Circle-spoke diagram

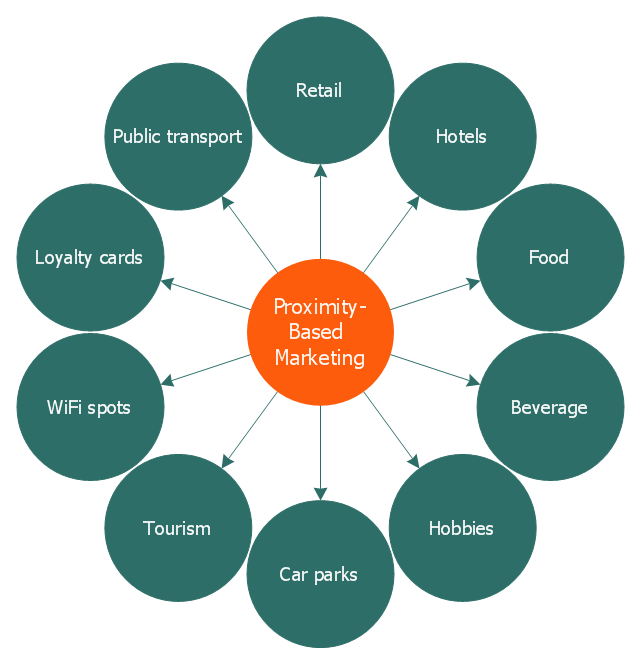
This circle-spoke diagram sample illustrates the proximity marketing.
"Proximity marketing is the localized wireless distribution of advertising content associated with a particular place. Transmissions can be received by individuals in that location who wish to receive them and have the necessary equipment to do so.
Distribution may be via a traditional localized broadcast, or more commonly is specifically targeted to devices known to be in a particular area.
The location of a device may be determined by:
(1) A cellular phone being in a particular cell.
(2) A Bluetooth or WiFi device being within range of a transmitter.
(3) An Internet enabled device with GPS enabling it to request localized content from Internet servers.
(4) A NFC enabled phone can read a RFID chip on a product or media and launch localized content from internet servers.
Communications may be further targeted to specific groups within a given location, for example content in tourist hot spots may only be distributed to devices registered outside the local area.
Communications may be both time and place specific, e.g. content at a conference venue may depend on the event in progress.
Uses of proximity marketing include distribution of media at concerts, information (weblinks on local facilities), gaming and social applications, and advertising." [Proximity marketing. Wikipedia]
The hub-and-spoke diagram example "Proximity based marketing" was created using the ConceptDraw PRO diagramming and vector drawing software extended with the Circle-Spoke Diagrams solution from the area "What is a Diagram" of ConceptDraw Solution Park.
Circle-spoke diagram
 Business Diagrams
The Business Diagrams Solution extends ConceptDraw DIAGRAM with an extensive collection of professionally designed illustrative samples and a wide variety of vector stencils libraries, which are the real help for all business-related people, business analysts, business managers, business advisers, marketing experts, PR managers, knowledge workers, scientists, and other stakeholders allowing them to design the bright, neat, expressive and attractive Bubble Diagrams, Circle-Spoke Diagrams, Circular Arrows Diagrams, and Venn Diagrams with different quantity of sets in just minutes; and then successfully use them in documents, reports, statistical summaries, and presentations of any style.
This circle-spoke diagram sample shows how leadership and data provide essential coordination of other functions in an asset management environment. Leadership points the way and common data systems keep all divisions communicating effectively.
This circle-spoke diagram example was created on the base of illustration of article "Beyond the Short Term: Transportation Asset Management for Long-Term Sustainability, Accountability and Performance" from the website of The Federal Highway Administration (FHWA).
[fhwa.dot.gov/ asset/ 10009/ tam_ topr806_ 3.cfm]
"Asset management, broadly defined, refers to any system that monitors and maintains things of value to an entity or group. It may apply to both tangible assets such as buildings and to intangible concepts such as intellectual property and goodwill. Asset management is a systematic process of operating, maintaining, upgrading, and disposing of assets cost-effectively. Alternative views of asset management in the engineering environment are: the practice of managing assets to achieve the greatest return (particularly useful for productive assets such as plant and equipment), and the process of monitoring and maintaining facilities systems, with the objective of providing the best possible service to users (appropriate for public infrastructure assets)." [Asset management. Wikipedia]
The hub-and-spoke diagram example "Leadership and data" was created using the ConceptDraw PRO diagramming and vector drawing software extended with the Circle-Spoke Diagrams solution from the area "What is a Diagram" of ConceptDraw Solution Park.
Circle-spoke diagram

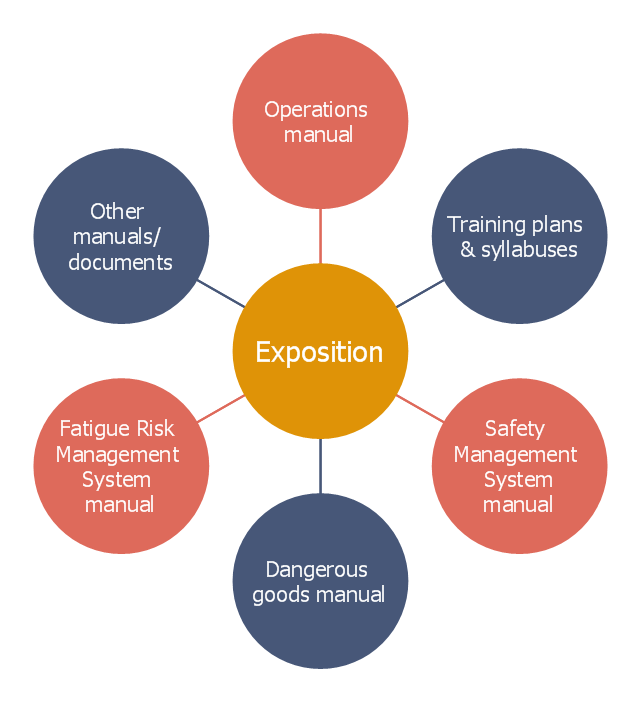
This circle-spoke diagram example was crated on the base of the illustration in the article "What is an exposition?" from the Civil Aviation Safety Authority (CASA) website.
"As the aviation industry transitions to new rules and safety standards through regulatory reform, organisations will be required to demonstrate to the Civil Aviation Safety Authority (CASA) how they have met the requirements outlined in the legislation, including the regulations and manual of standards applicable to their operation through a document called an exposition.
An exposition is a description of how organisations will conduct their operations to maintain the required level of safety. The exposition is the primary document, supported by a series of manuals, such as the operations manual and safety management system manual. These manuals and other supporting documents form part of the exposition document set, as shown in the ... diagram." [casa.gov.au/ scripts/ nc.dll?WCMS:STANDARD::pc=PC_ 101706]
The hub-and-spoke diagram example "CASA exposition" was created using the ConceptDraw PRO diagramming and vector drawing software extended with the Circle-Spoke Diagrams solution from the area "What is a Diagram" of ConceptDraw Solution Park.
Circle-spoke diagram
- Social determinants of health | CEEBL structure | Circle- Spoke ...
- Hub Spoke Diagram
- Hub And Spoke Icon
- Hub And Spoke Diagram
- Spoke Diagram
- Social determinants of health | Circle- Spoke Diagrams | Basic Circle ...
- Social Ecological Model (SEM) - Onion diagram | Circle- Spoke ...
- Social determinants of health - Hub -and- spoke diagram | Circle ...
- Sector diagram - Template | Basic Circle- Spoke Diagrams | Porter ...
- Porter five forces model | Block diagram - Porter's five forces model ...