ConceptDraw PRO Database Modeling Software

This AD diagram example was redesigned from the picture "Site links" from the book "Active Directory for Dummies".
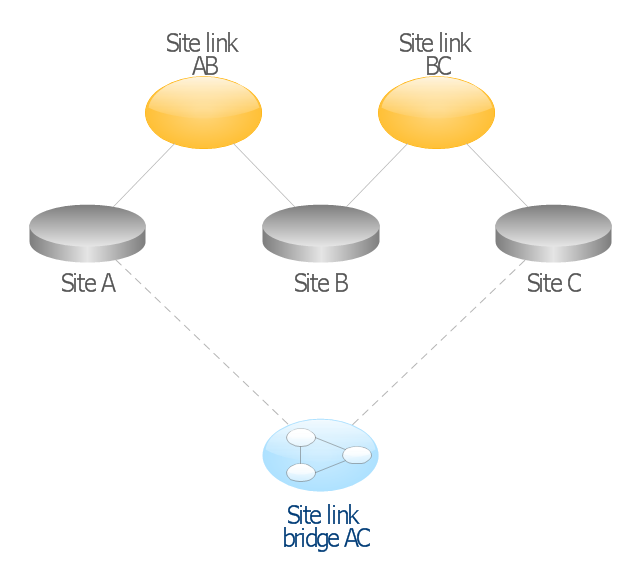
"Site links represent the Active Directory replication paths between sites.
These paths are manually defined so that the designer has control over which network links the replication traffic occurs on. These site links also control how clients are directed to domain controllers when there’s no DC in the client’s local site. Each site link has the following attributes:
(1) Connected sites: A site link is defined by the sites to which it connects. A site link can connect two or more sites together.
(2) Network transport: Site links support replication communication over IP-based RPCs or with the Simple Mail Transport Protocol (SMTP). You normally want to use RPC whenever possible, but you can use SMTP when the sites you’re linking don’t support RPC.
(3) Cost: Each site link has a cost associated with it. Costs are used to assign preferences to links that determine which link should be followed when multiple link paths are available between sites. The cost represents what it “costs” to use this site link relative to the other site links and affects replication traffic as well as how users are assigned a domain controller. Links with lower cost values have preference over links with higher cost values. Cost values range from 1–32,767; the default being 100.
(4) Frequency: The frequency value defines how often a replication occurs
when using this site link (the replication latency). You can configure the time between replications from a minimum of 15 minutes to a maximum of 10,080 minutes (one week). The default frequency is 180 minutes.
(5) Schedule: The schedule dictates when this link is active and available for replication between the sites. The schedule can also control which days of the week the link is available. Normally, the schedule is set so that the link is available 24 hours a day, but you can set up different schedules on a per-day-of-the-week basis.
By creating a site link, you enable two or more sites to be connected and to share the same site link attributes (transport, cost, frequency, and schedule). By default, site links create transitive connectivity between sites.
If you create a site link between sites A and B and another site link between
sites B and C, an automatic connection (known as a site link bridge) is created between sites A and C..." [Steve Clines and Marcia Loughry, Active Directory® For Dummies®, 2nd Edition. 2008]
The Active Directory diagram example "Site links" was created using the ConceptDraw PRO diagramming and vector drawing software extended with the Active Directory Diagrams solution from the Computer and Networks area of ConceptDraw Solution Park.
Active Directory network diagram
This example of bank ATM UML activity diagram was created on the base of UML use case diagram of automated teller machine from the course "Thinking in Java, 2nd edition, Revision 9" by Bruce Eckel published on the website of the Computer Science and Electrical Engineering Department of the University of Maryland, Baltimore (UMBC).
"If you are designing an auto-teller, for example, the use case for a particular aspect of the functionality of the system is able to describe what the auto-teller does in every possible situation. Each of these “situations” is referred to as a scenario, and a use case can be considered a collection of scenarios. You can think of a scenario as a question that starts with: “What does the system do if...?” For example, “What does the auto-teller do if a customer has just deposited a check within the last 24 hours, and there’s not enough in the account without the check having cleared to provide a desired withdrawal?”
Use case diagrams are intentionally simple to prevent you from getting bogged down in system implementation details prematurely...
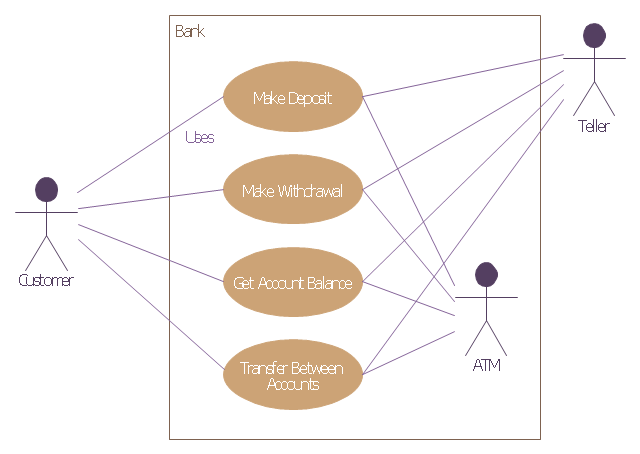
Each stick person represents an “actor,” which is typically a human or some other kind of free agent. (These can even be other computer systems, as is the case with “ATM.”) The box represents the boundary of your system. The ellipses represent the use cases, which are descriptions of valuable work that can be performed with the system. The lines between the actors and the use cases represent the interactions.
It doesn’t matter how the system is actually implemented, as long as it looks like this to the user."
[csee.umbc.edu/ courses/ 331/ resources/ tij/ text/ TIJ213.gif]
This automated teller machine (ATM) UML use case diagram example was created using the ConceptDraw PRO diagramming and vector drawing software extended with the ATM UML Diagrams solution from the Software Development area of ConceptDraw Solution Park.
"If you are designing an auto-teller, for example, the use case for a particular aspect of the functionality of the system is able to describe what the auto-teller does in every possible situation. Each of these “situations” is referred to as a scenario, and a use case can be considered a collection of scenarios. You can think of a scenario as a question that starts with: “What does the system do if...?” For example, “What does the auto-teller do if a customer has just deposited a check within the last 24 hours, and there’s not enough in the account without the check having cleared to provide a desired withdrawal?”
Use case diagrams are intentionally simple to prevent you from getting bogged down in system implementation details prematurely...
Each stick person represents an “actor,” which is typically a human or some other kind of free agent. (These can even be other computer systems, as is the case with “ATM.”) The box represents the boundary of your system. The ellipses represent the use cases, which are descriptions of valuable work that can be performed with the system. The lines between the actors and the use cases represent the interactions.
It doesn’t matter how the system is actually implemented, as long as it looks like this to the user."
[csee.umbc.edu/ courses/ 331/ resources/ tij/ text/ TIJ213.gif]
This automated teller machine (ATM) UML use case diagram example was created using the ConceptDraw PRO diagramming and vector drawing software extended with the ATM UML Diagrams solution from the Software Development area of ConceptDraw Solution Park.
Bank ATM UML sequence diagram
This work flow chart sample was redesigned from the picture "Weather Forecast" from the article "Simulation Workflows".
[iaas.uni-stuttgart.de/ forschung/ projects/ simtech/ sim-workflows.php]
"(1) The weather is predicted for a particular geological area. Hence, the workflow is fed with a model of the geophysical environment of ground, air and water for a requested area.
(2) Over a specified period of time (e.g. 6 hours) several different variables are measured and observed. Ground stations, ships, airplanes, weather balloons, satellites and buoys measure the air pressure, air/ water temperature, wind velocity, air humidity, vertical temperature profiles, cloud velocity, rain fall, and more.
(3) This data needs to be collected from the different sources and stored for later access.
(4) The collected data is analyzed and transformed into a common format (e.g. Fahrenheit to Celsius scale). The normalized values are used to create the current state of the atmosphere.
(5) Then, a numerical weather forecast is made based on mathematical-physical models (e.g. GFS - Global Forecast System, UKMO - United Kingdom MOdel, GME - global model of Deutscher Wetterdienst). The environmental area needs to be discretized beforehand using grid cells. The physical parameters measured in Step 2 are exposed in 3D space as timely function. This leads to a system of partial differential equations reflecting the physical relations that is solved numerically.
(6) The results of the numerical models are complemented with a statistical interpretation (e.g. with MOS - Model-Output-Statistics). That means the forecast result of the numerical models is compared to statistical weather data. Known forecast failures are corrected.
(7) The numerical post-processing is done with DMO (Direct Model Output): the numerical results are interpolated for specific geological locations.
(8) Additionally, a statistical post-processing step removes failures of measuring devices (e.g. using KALMAN filters).
(9) The statistical interpretation and the numerical results are then observed and interpreted by meteorologists based on their subjective experiences.
(10) Finally, the weather forecast is visualized and presented to interested people." [iaas.uni-stuttgart.de/ forschung/ projects/ simtech/ sim-workflows.php]
The example "Workflow diagram - Weather forecast" was drawn using the ConceptDraw PRO diagramming and vector drawing software extended with the Workflow Diagrams solution from the Business Processes area of ConceptDraw Solution Park.
Work flow chart

 ConceptDraw Solution Park
ConceptDraw Solution Park collects graphic extensions, examples and learning materials
- ConceptDraw PRO ER Diagram Tool | How to Draw a Building ...
- Network Diagram Software Home Area Network | How To use ...
- How To use House Electrical Plan Software | Wiring Diagrams with ...
- How To use House Electrical Plan Software | How To use Electrical ...
- Home area networks (HAN). Computer and Network Examples ...
- Structured Systems Analysis and Design Method (SSADM) with ...
- Database Diagram
- Martin ERD Diagram | ConceptDraw PRO Database Modeling ...
- ORM Diagram
- UML for Bank | UML use case diagram - Banking system | Class ...
- Express-G Diagram | Software Diagram Examples and Templates ...
- How to Create an Azure Architecture Diagram Using ConceptDraw ...
- Entity Relationship Diagram Software Engineering | Technical ...
- Data Modeling Diagram | Data modeling with ConceptDraw PRO ...
- Entity-Relationship Diagram (ERD) with ConceptDraw PRO ...
- Database Modeling Diagram
- Data structure diagram with ConceptDraw PRO | Program Structure ...
- Data Flow Diagram
- ConceptDraw PRO Compatibility with MS Visio | Replace Your ...
- How to Open MS Visio® 2013/2016 Files on a Mac® Using ...