The vector stencils library "Plane geometry" contains 27 plane geometric figures.
Use these shapes to draw your geometrical diagrams and illustrations in the ConceptDraw PRO diagramming and vector drawing software extended with the Mathematics solution from the Science and Education area of ConceptDraw Solution Park.
Use these shapes to draw your geometrical diagrams and illustrations in the ConceptDraw PRO diagramming and vector drawing software extended with the Mathematics solution from the Science and Education area of ConceptDraw Solution Park.
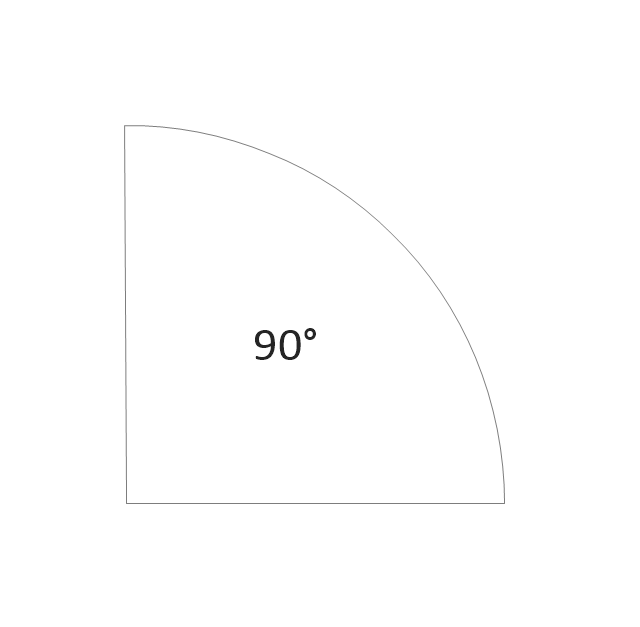
Circular sector
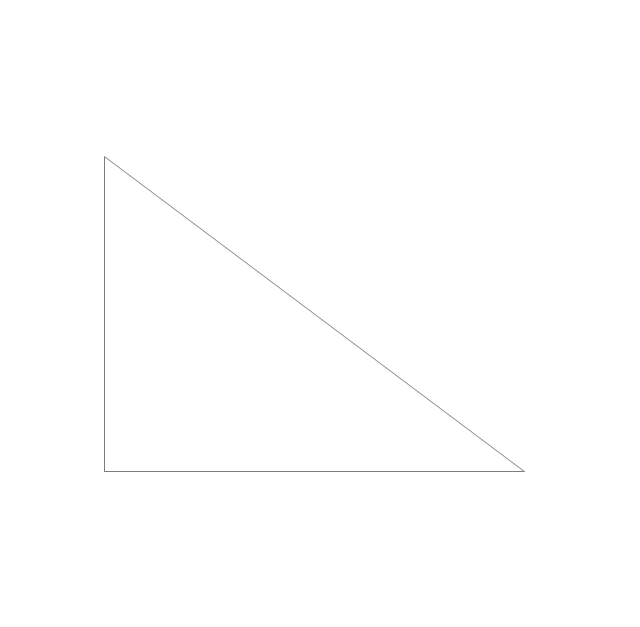
Right triangle
Rectangle

Square

Pentagon

Isosceles trapezium

Parallelogram

Trapezium

Three-pointed star

Four-pointed star

Five-pointed star

Six-pointed star

Seven-pointed star

Eight-pointed star

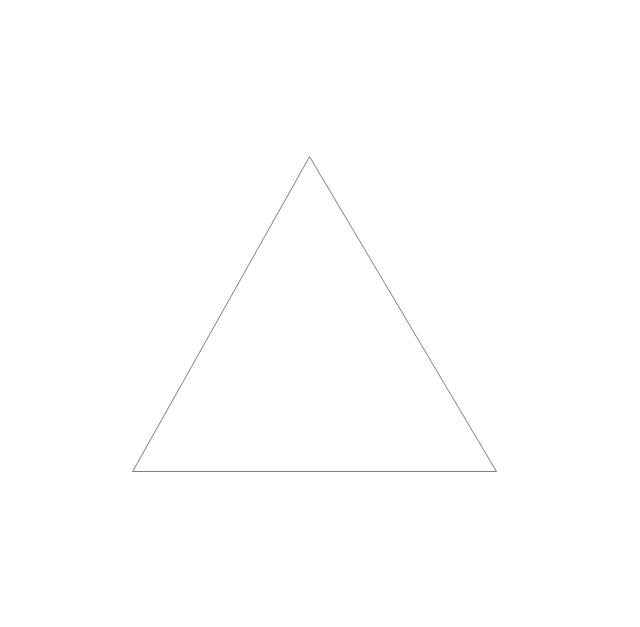
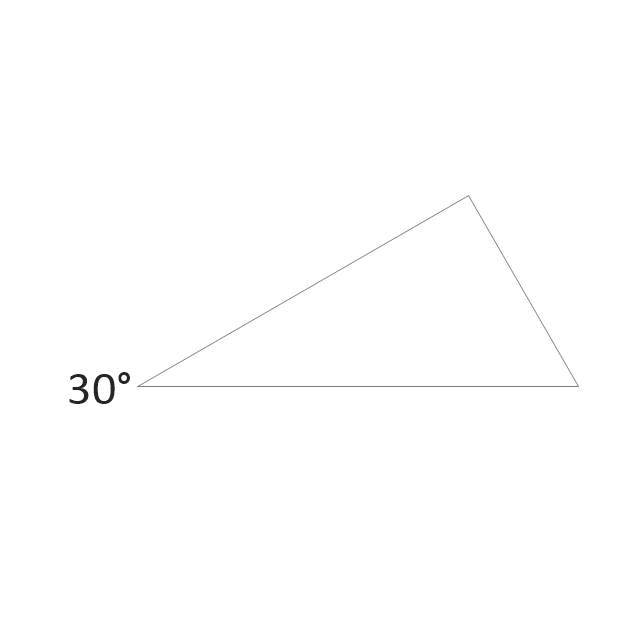
Triangle
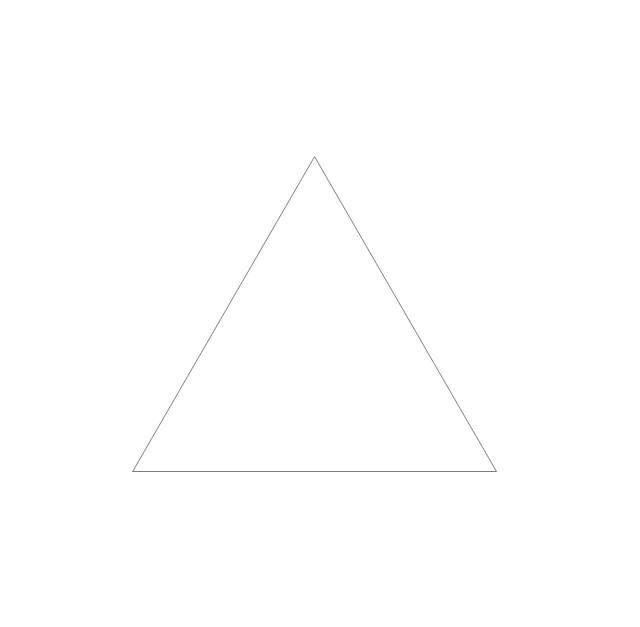
Equilateral triangle
Right triangle 2
Right triangle, angle box
Right triangle 3
Hexagon

Regular hexagon

Regular pentagon
Regular heptagon
Regular octagon
Rhombus

Circle

Ellipse

The vector stencils library "Concept maps" contains 16 geometrical shapes.
Use it to create your concept maps, mindmaps, idea maps, tree diagrams, omega maps, cluster diagrams and spider diagrams.
The symbols example "Concept maps - Vector stencils library" was created using the ConceptDraw PRO diagramming and vector drawing software extended with the Concept Maps solution from the area "What is a Diagram" of ConceptDraw Solution Park.
Rectangle

Rounded rectangle

Stadium

Oval
Diamond
Parallelogram

Circle

Star

Hexagon

Cloud

Starburst

Arrow
Envelope

Note
Callout

Table
The vector stencils library "Plane geometry" contains 27 plane geometric figures.
Use these shapes to draw your geometrical diagrams and illustrations in the ConceptDraw PRO diagramming and vector drawing software extended with the Mathematics solution from the Science and Education area of ConceptDraw Solution Park.
Use these shapes to draw your geometrical diagrams and illustrations in the ConceptDraw PRO diagramming and vector drawing software extended with the Mathematics solution from the Science and Education area of ConceptDraw Solution Park.
Circular sector
Right triangle
Rectangle
Square
Pentagon
Isosceles trapezium
Parallelogram
Trapezium
Three-pointed star
Four-pointed star
Five-pointed star
Six-pointed star
Seven-pointed star
Eight-pointed star
Triangle
Equilateral triangle
Right triangle 2
Right triangle, angle box
Right triangle 3
Hexagon
Regular hexagon
Regular pentagon
Regular heptagon
Regular octagon
Rhombus
Circle
Ellipse
The vector stencils library "Concept maps" contains 16 geometrical shapes.
Use it to create your concept maps, mindmaps, idea maps, tree diagrams, omega maps, cluster diagrams and spider diagrams.
The symbols example "Concept maps - Vector stencils library" was created using the ConceptDraw PRO diagramming and vector drawing software extended with the Concept Maps solution from the area "What is a Diagram" of ConceptDraw Solution Park.
Use it to create your concept maps, mindmaps, idea maps, tree diagrams, omega maps, cluster diagrams and spider diagrams.
The symbols example "Concept maps - Vector stencils library" was created using the ConceptDraw PRO diagramming and vector drawing software extended with the Concept Maps solution from the area "What is a Diagram" of ConceptDraw Solution Park.
Rectangle
Rounded rectangle
Stadium
Oval
Diamond
Parallelogram
Circle
Star
Hexagon
Cloud
Starburst
Arrow
Envelope
Note
Callout
Table
The vector stencils library "Circular diagrams" contains 42 templates of circular diagrams: circular arrow diagram, circular motion diagram, arrow ring chart, doughnut chart (donut chart), circle pie chart, diamond pie chart, circle diagram, pie chart, ring chart, loop diagram, block loop diagram, arrow loop circle, crystal diagram, triangular diagram, diamond diagram, pentagon diagram, hexagon diagram, heptagon diagram, cycle diagram (cycle chart), stacked Venn diagram (onion diagram), arrow circle diagram.
Use these shapes to illustrate your marketing and sales documents, presentations, webpages and infographics in the ConceptDraw PRO diagramming and vector drawing software extended with the Target and Circular Diagrams solution from the Marketing area of ConceptDraw Solution Park.
www.conceptdraw.com/ solution-park/ marketing-target-and-circular-diagrams
Circular arrow diagram 1
Circular arrow diagram 2
Arrow ring chart
Doughnut chart

Diamond pie chart

Pie chart

Circle diagram

Circle pie chart 2

Circle pie chart 1

Ring chart 1 - 3 elements

Ring chart 1 - 4 elements

Ring chart 1 - 5 elements

Ring chart 1 - 6 elements

Ring chart 1 - 7 elements

Ring chart 2 - 3 elements

Ring chart 2 - 4 elements

Ring chart 2 - 5 elements

Ring chart 2 - 6 elements

Ring chart 2 - 7 elements

Crystal diagram - 3 elements

Crystal diagram - 4 elements

Crystal diagram - 5 elements

Crystal diagram - 6 elements

Crystal diagram - 7 elements

Stacked Venn diagram - 4

Stacked Venn diagram - 5

Stacked Venn diagram - 6

Stacked Venn diagram - 7

Basic loop diagram

Block loop diagram

Arrow loop circle
Arrow loop - 3 circles
Arrow loop - 4 circles
Arrow loop - 5 circles
Arrow loop - 6 circles
Arrow loop - 7 circles
Arrow circle diagram - 3
Arrow circle diagram - 4
Stacked Venn diagram - 3

Arrow circle diagram - 5
Arrow circle diagram - 6
Arrow circle diagram - 7
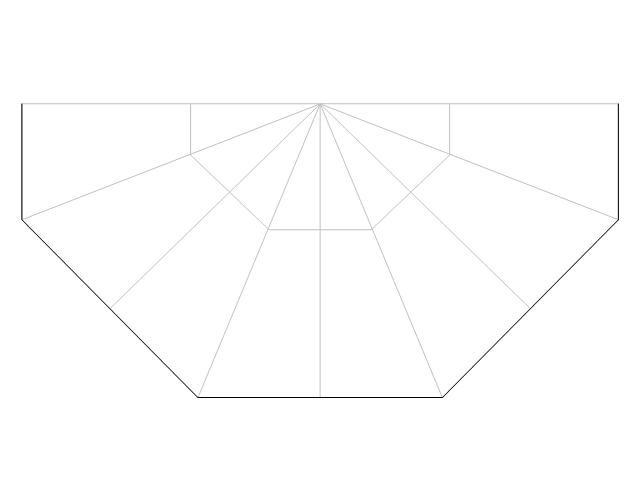
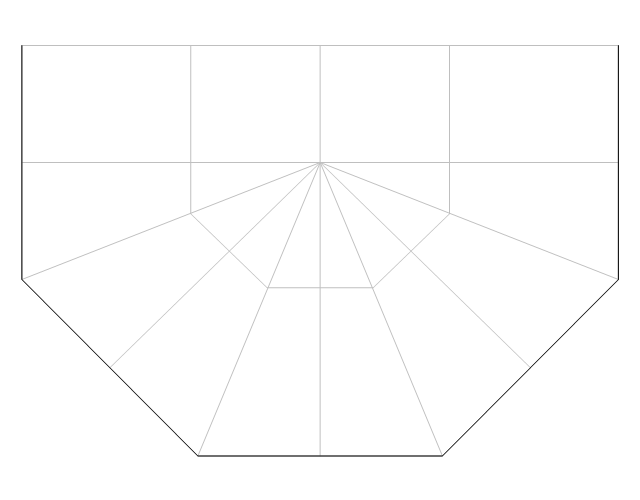
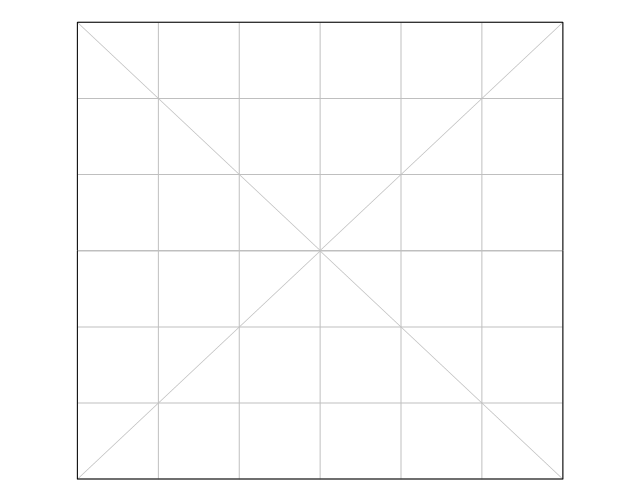
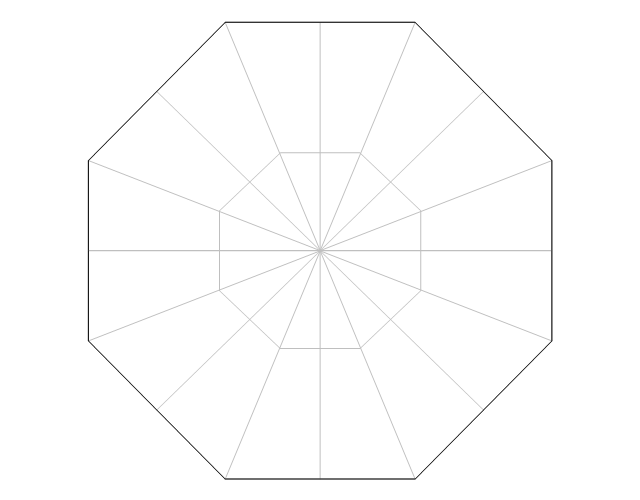
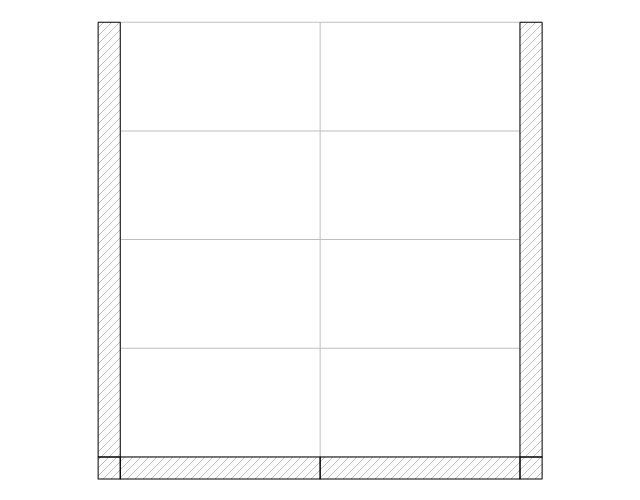
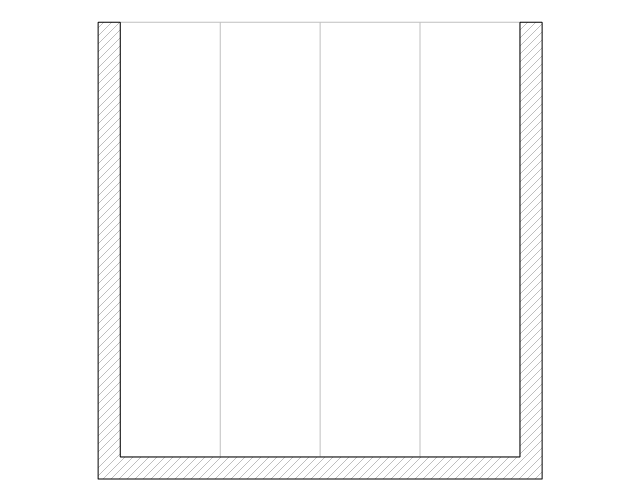
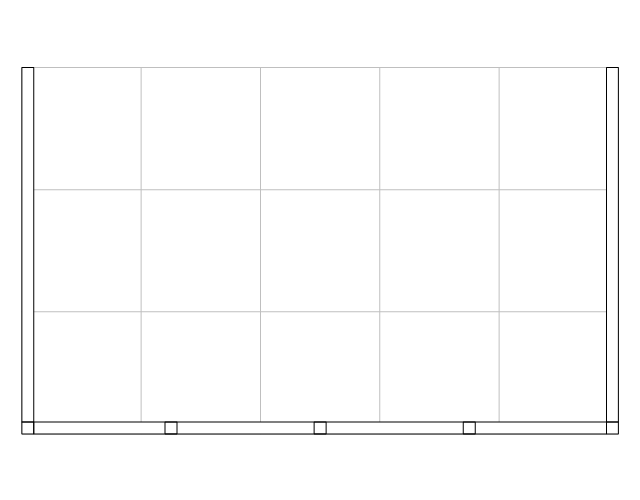
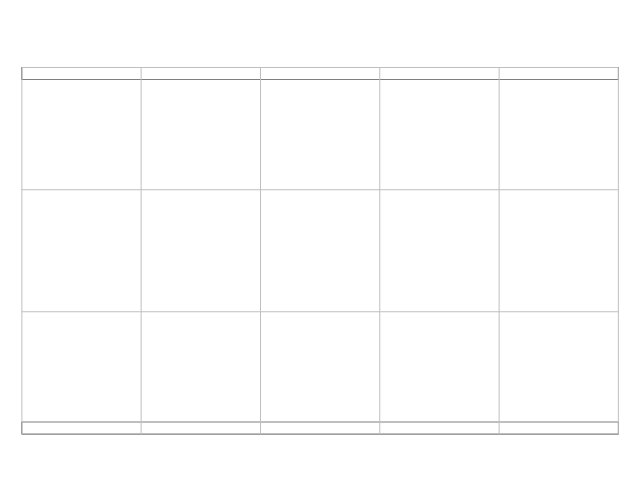
The vector stencils library "Sunrooms" contains 12 shapes of glass roof and conservatory. Use it for drawing sunroom design plans, home layouts, architectural and construction documents in the ConceptDraw PRO diagramming and vector drawing software extended with the Floor Plans solution from the Building Plans area of ConceptDraw Solution Park.
Georgian conservatory 1
Georgian conservatory 2
Victorian conservatory 1
Victorian conservatory 2
Square roof
Hexagonal roof
Cathedral solid roof
Straight solid roof
Straight glass roof
Curved glass roof
Roof piece 1

Roof piece 2

The vector stencils library "Concept maps" contains 16 geometrical shapes.
Use it to create your concept maps, mindmaps, idea maps, tree diagrams, omega maps, cluster diagrams and spider diagrams.
The symbols example "Concept maps - Vector stencils library" was created using the ConceptDraw PRO diagramming and vector drawing software extended with the Concept Maps solution from the area "What is a Diagram" of ConceptDraw Solution Park.
Use it to create your concept maps, mindmaps, idea maps, tree diagrams, omega maps, cluster diagrams and spider diagrams.
The symbols example "Concept maps - Vector stencils library" was created using the ConceptDraw PRO diagramming and vector drawing software extended with the Concept Maps solution from the area "What is a Diagram" of ConceptDraw Solution Park.
Rectangle
Rounded rectangle
Stadium
Oval
Diamond
Parallelogram
Circle
Star
Hexagon
Cloud
Starburst
Arrow
Envelope
Note
Callout
Table
This hexagon diagram sample was redesigned from the Wikipedia file: Virtuous circle in macroeconomics.svg. "An example of the use of a virtuous circle in macroeconomics."
[en.wikipedia.org/ wiki/ File:Virtuous_ circle_ in_ macroeconomics.svg]
"A virtuous circle and a vicious circle (also referred to as virtuous cycle and vicious cycle) are economic terms. They refer to a complex chain of events that reinforces itself through a feedback loop. A virtuous circle has favorable results, while a vicious circle has detrimental results.
Both circles are complexes of events with no tendency towards equilibrium (at least in the short run). Both systems of events have feedback loops in which each iteration of the cycle reinforces the previous one (positive feedback). These cycles will continue in the direction of their momentum until an external factor intervenes and breaks the cycle. The prefix "hyper-" is sometimes used to describe these cycles if they are extreme. The best-known example of a vicious circle is hyperinflation. ...
Example in macroeconomics.
Virtuous circle.
Economic growth can be seen as a virtuous circle. It might start with an exogenous factor such as technological innovation. As people get familiar with the new technology, there could be learning curve effects and economies of scale. This could lead to reduced costs and improved production efficiencies. In a competitive market structure, this will probably result in lower average prices or a decrease in employment as it takes fewer workers to produce the same output. As prices decrease, consumption could increase and aggregate output also. Increased levels of output lead to more learning and scale effects and a new cycle starts."
[en.wikipedia.org/ wiki/ Virtuous_ circle_ and_ vicious_ circle]
The crystal diagram example "Virtuous circle (macroeconomics)" was created using the ConceptDraw PRO diagramming and vector drawing software extended with the Target and Circular Diagrams solution from the Marketing area of ConceptDraw Solution Park.
www.conceptdraw.com/ solution-park/ marketing-target-and-circular-diagrams
Hexagon diagram
---crystal-diagram.png--diagram-flowchart-example.png)
This hexagon diagram sample was redesigned from the Wikipedia file: Vicious circle in macroeconomics.svg. "An example of the use of a vicious circle in macroeconomics." [en.wikipedia.org/ wiki/ File:Vicious_ circle_ in_ macroeconomics.svg]
"A virtuous circle and a vicious circle (also referred to as virtuous cycle and vicious cycle) are economic terms. They refer to a complex chain of events that reinforces itself through a feedback loop. A virtuous circle has favorable results, while a vicious circle has detrimental results.
Both circles are complexes of events with no tendency towards equilibrium (at least in the short run). Both systems of events have feedback loops in which each iteration of the cycle reinforces the previous one (positive feedback). These cycles will continue in the direction of their momentum until an external factor intervenes and breaks the cycle. The prefix "hyper-" is sometimes used to describe these cycles if they are extreme. The best-known example of a vicious circle is hyperinflation. ...
Example in macroeconomics.
Vicious circle.
Hyperinflation is a spiral of inflation which causes even higher inflation. The initial exogenous event might be a sudden large increase in international interest rates or a massive increase in government debt due to excessive spendings. Whatever the cause, the government could pay down some of its debt by printing more money (called monetizing the debt). This increase in the money supply could increase the level of inflation. In an inflationary environment, people tend to spend their money quickly because they expect its value to decrease further in the future. They convert their financial assets into physical assets while their money still has some purchasing power. Often they will purchase on credit. Eventually, the currency loses all of its value. Because of this, the level of savings in the country is very low and the government could have problems refinancing its debt. Its solution could be to print still more money starting another iteration of the vicious cycle." [Virtuous circle and vicious circle. Wikipedia]
The crystal diagram example "Vicious circle" was created using the ConceptDraw PRO diagramming and vector drawing software extended with the Target and Circular Diagrams solution from the Marketing area of ConceptDraw Solution Park.
www.conceptdraw.com/ solution-park/ marketing-target-and-circular-diagrams
Hexagon diagram

Flow Chart Symbols

- Design elements - Sunrooms | Hexagon Glass Png
- Hexagon Design Png
- Vector Hexagonal Png
- Sunrooms - Vector stencils library | White Hegzagonal Shape Png
- Basic Flowchart Symbols and Meaning | Plane geometry - Vector ...
- Plane geometry - Vector stencils library
- Concept maps - Vector stencils library | UML Object Diagram ...
- Hexagon Logo
- Abstract Hexagon
- Plane geometry - Vector stencils library | Polygon types | Circular ...