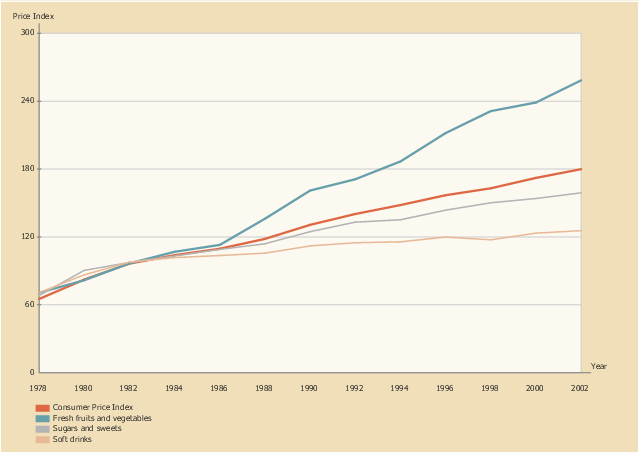
This line graph sample shows the relative price changes for fresh fruits and vegetables, sugars and sweets, and soft drinks, using the period 1982–84 as the baseline (index = 100), 1978–2002. It was designed on the base of line chart from the website of the U.S. National Center for Chronic Disease Prevention and Health Promotion.
"The number of overweight and obese youth has increased in recent decades, yet few data assess how the lives of children have changed during the “obesity epidemic.” ...
Eating as a primary activity declined, suggesting a shift toward snacking or eating as a secondary activity. Statistically significant trends exist for carbohydrate intake, especially for chips/ crackers/ popcorn/ pretzels (intake tripled from the mid-1970s to the mid-1990s) and soft drinks (intake doubled during the same period). Price and income data suggest possible economic reasons for these changes. The percentage of disposable income spent on food has declined continuously, and almost all of the decline has been represented by food consumed at home, yet today’s disposable income buys more calories than it has in the past. Relative prices have encouraged shifts across food types. From a baseline of 100 during 1982–84, the price index for fresh fruit and vegetables increased to 258 by 2002 (far exceeding general inflation), whereas the price index for soft drinks increased only to 126 by 2002 (below general inflation)." [cdc.gov/ pcd/ issues/ 2005/ apr/ 04_ 0039.htm]
The line chart example "Relative price changes for fresh fruits and vegetables, sugars, sweets, soft drinks" was created using the ConceptDraw PRO diagramming and vector drawing software extended with the Line Graphs solution from the Graphs and Charts area of ConceptDraw Solution Park.
Line chart
Drawing Illustration

The vector stencils library "Picture Graphs" contains 35 templates of picture bar graphs for visual data comparison and time series.
Drag a template from the library to your document, set bars number, type category labels, select bars and enter your data.
Use these shapes to draw your pictorial bar charts in the ConceptDraw PRO diagramming and vector drawing software.
The vector stencils library "Picture Graphs" is included in the Picture Graphs solution from the Graphs and Charts area of ConceptDraw Solution Park.
Arrow
Water drop

Food

Grain

Agriculture

Medicines

Houses

Buildings

Money bags

Oil barrels

Natural gas

Electrical power

Nuclear power

Mechanical engineering

Chemical industry

Mining

Gold bars

Coins

Person

Men, women and children

Man

Woman

Child

Milk

Meat

Fruits

Vegetables

Computer

Mobile phone

Airliner

Car

Bus

Truck

Train

Cargo ship

 Pie Charts
Pie Charts are extensively used in statistics and business for explaining data and work results, in mass media for comparison (i.e. to visualize the percentage for the parts of one total), and in many other fields. The Pie Charts solution for ConceptDraw PRO v10 offers powerful drawing tools, varied templates, samples, and a library of vector stencils for simple construction and design of Pie Charts, Donut Chart, and Pie Graph Worksheets.
- Bar Chart Template for Word | Fruits Drawing Individual
- Drawing a Nature Scene | Food Court | Fruit Art | Flow Chart In ...
- Drawing a Nature Scene | Healthy Foods | Fruit Art | Flow Chart ...
- Fruit Art | Food Images | Bar Chart Template for Word | Drawing ...
- Pictures of Vegetables | Food Art | Fruit Art | Sample Drawing For ...
- Fruit Art | Example of DFD for Online Store (Data Flow Diagram ...
- Bar Chart Template for Word | Food Court | Fruit Art | Fruit Diagram ...
- Fruits Chart Of Drawing
- Fruit Chart Image To Draw
- Fruit Chart Simple Drawing
- Fruits We Eat In Drawn Diagram
- Vegetables Charts Drawing
- Design Of Fruit Chart
- Food Images | Food Court | Fruit Chart Competition Example
- Healthy Food Ideas | Healthy Foods | Fruit Art | Make A Flow Chart ...
- Fruit Art | Food Court | Health Food | Fruit Chart With Design Elements
- Using Flow Chart Describe The Processing Of Fruit And Vegetable
- Fruit Art | Types of Flowchart - Overview | Chore charts with ...
- Fruit Art | Healthy Meal Recipes | Prepare A Flow Chart Of Balance ...