HelpDesk
How to Create Flowchart Using Standard Flowchart Symbols

"The general definition of an audit is a planned and documented activity performed by qualified personnel to determine by investigation, examination, or evaluation of objective evidence, the adequacy and compliance with established procedures, or applicable documents, and the effectiveness of implementation. The term may refer to audits in accounting, internal controls, quality management, project management, water management, and energy conservation.
Auditing is defined as a systematic and independent examination of data, statements, records, operations and performances (financial or otherwise) of an enterprise for a stated purpose. In any auditing the auditor perceives and recognizes the propositions before him for examination, collects evidence, evaluates the same and on this basis formulates his judgment which is communicated through his audit report. The purpose is then to give an opinion on the adequacy of controls (financial and otherwise) within an environment they audit, to evaluate and improve the effectiveness of risk management, control, and governance processes." [Audit. Wikipedia]
The audit flowchart example "Audit process flowchart" was created using the ConceptDraw PRO diagramming and vector drawing software extended with the Audit Flowcharts solution from the Finance and Accounting area of ConceptDraw Solution Park.
Audit Process Flowchart
.png--diagram-flowchart-example.png)
Section 1
.png--diagram-flowchart-example.png)
Section 2
.png--diagram-flowchart-example.png)
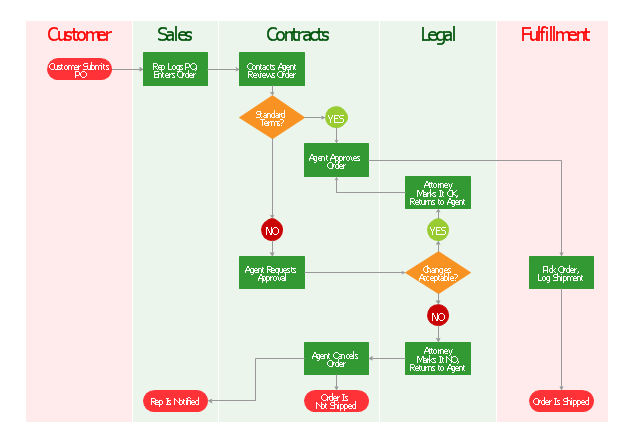
"Order processing is a key element of Order fulfillment. Order processing operations or facilities are commonly called "distribution centers". "Order processing" is the term generally used to describe the process or the work flow associated with the picking, packing and delivery of the packed item(s) to a shipping carrier. The specific "order fulfillment process" or the operational procedures of distribution centers are determined by many factors. Each distribution center has its own unique requirements or priorities." [Order processing. Wikipedia]
The vertical cross-functional flow chart example "Order processing" was created using the ConceptDraw PRO diagramming and vector drawing software extended with the Flowcharts solution from the area "What is a Diagram" of ConceptDraw Solution Park.
The vertical cross-functional flow chart example "Order processing" was created using the ConceptDraw PRO diagramming and vector drawing software extended with the Flowcharts solution from the area "What is a Diagram" of ConceptDraw Solution Park.
Cross-functional flowchart
The vector stencils library "Flowchart" contains 26 symbols for drawing flowcharts.
Use these shapes to draw your flow charts in the ConceptDraw PRO diagramming and vector drawing software extended with the Flowcharts solution from the area "What is a Diagram" of ConceptDraw Solution Park.
www.conceptdraw.com/ solution-park/ diagram-flowcharts
Use these shapes to draw your flow charts in the ConceptDraw PRO diagramming and vector drawing software extended with the Flowcharts solution from the area "What is a Diagram" of ConceptDraw Solution Park.
www.conceptdraw.com/ solution-park/ diagram-flowcharts
Terminator

Process

Decision

Delay

Subroutine

Data

Document

Multiple documents

Preparation

Display

Manual input

Manual loop

Loop limit

Connector

Off-page connector

Off-page connector

Off-page connector

Off-page connector

Or

Summing junction

Collate

Sort

Merge

Stored data

Database

Internal storage

"A website, also written as Web site, web site, or simply site, is a set of related web pages served from a single web domain. A website is hosted on at least one web server, accessible via a network such as the Internet or a private local area network through an Internet address known as a Uniform resource locator. All publicly accessible websites collectively constitute the World Wide Web.
A webpage is a document, typically written in plain text interspersed with formatting instructions of Hypertext Markup Language (HTML, XHTML). A webpage may incorporate elements from other websites with suitable markup anchors.
Webpages are accessed and transported with the Hypertext Transfer Protocol (HTTP), which may optionally employ encryption (HTTP Secure, HTTPS) to provide security and privacy for the user of the webpage content. The user's application, often a web browser, renders the page content according to its HTML markup instructions onto a display terminal.
The pages of a website can usually be accessed from a simple Uniform Resource Locator (URL) called the web address. The URLs of the pages organize them into a hierarchy, although hyperlinking between them conveys the reader's perceived site structure and guides the reader's navigation of the site which generally includes a home page with most of the links to the site's web content, and a supplementary about, contact and link page." [Website. Wikipedia]
The flow chart example "Website launch" was created using the ConceptDraw PRO diagramming and vector drawing software extended with the Flowcharts solution from the area "What is a Diagram" of ConceptDraw Solution Park.
Flowchart - Website launch
This accounting flowchart example was created on the base of the figure from the website of the Office of the State Comptroller. [osc.ct.gov/ manuals/ acctdirect/ question03.htm]
"Purchasing is the formal process of buying goods and services. The purchasing process can vary from one organization to another, but there are some common key elements.
The process usually starts with a demand or requirements – this could be for a physical part (inventory) or a service. A requisition is generated, which details the requirements (in some cases providing a requirements speciation) which actions the procurement department. A request for proposal (RFP) or request for quotation (RFQ) is then raised. Suppliers send their quotations in response to the RFQ, and a review is undertaken where the best offer (typically based on price, availability and quality) is given the purchase order." [Purchasing process. Wikipedia]
The accounting flowchart example "Purchasing flowchart" was created using the ConceptDraw PRO software extended with the Accounting Flowcharts solution from the Finance and Accounting area of ConceptDraw Solution Park.
Accounting flowchart
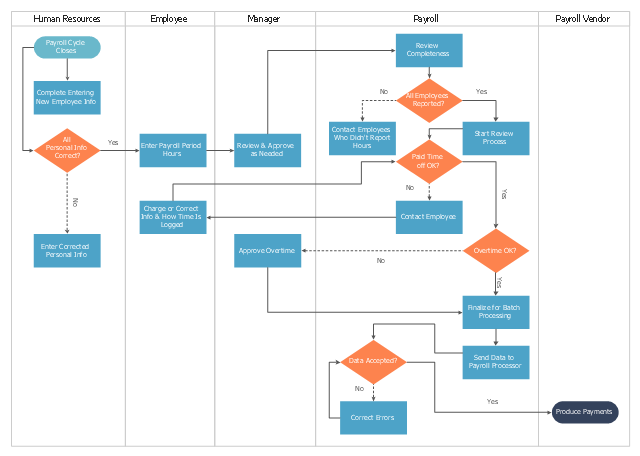
This cross-functional flowchart sample represents the payroll process mapping.
"Business process mapping refers to activities involved in defining what a business entity does, who is responsible, to what standard a business process should be completed, and how the success of a business process can be determined.
The main purpose behind business process mapping is to assist organizations in becoming more efficient. A clear and detailed business process map or diagram allows outside firms to come in and look at whether or not improvements can be made to the current process.
Business process mapping takes a specific objective and helps to measure and compare that objective alongside the entire organization's objectives to make sure that all processes are aligned with the company's values and capabilities.
ISO 9001 requires a business entity to follow a process approach when managing its business, and to this end creating business process maps will assist. The entity can then work towards ensuring its processes are effective (the right process is followed the first time), and efficient (continually improved to ensure processes use the smallest amount of resources)." [Business process mapping. Wikipedia]
The business process map example "Swim lane diagram - Payroll process mapping" was drawn using the ConceptDraw PRO diagramming and vector drawing software extended with the Cross-Functional Flowcharts solution from the Business Processes area of ConceptDraw Solution Park.
Cross-functional flowchart
The vector stencils library "Audit flowcharts" contains 31 flow chart symbols.
Use it in accounting, financial management, fiscal information tracking, money management, decision making, and financial inventories to create auditing flowchart diagrams in the ConceptDraw PRO diagramming and vector drawing software extended with the Audit Flowcharts solution from the Finance and Accounting area of ConceptDraw Solution Park.
www.conceptdraw.com/ solution-park/ finance-audit-flowcharts
Tagged Process

Tagged Document

Decision

Manual operation

Terminator

Manual File

Display

On-page reference

Off-page reference

Divided (Table View)
-audit-flowcharts---vector-stencils-library.png--diagram-flowchart-example.png)
Process

Lined / shaded process

Lined Document

Document

Database

Disk Storage

Floppy disk

Magnetic Tape

Data Transmission

Manual input

Check 1 (audit)
-audit-flowcharts---vector-stencils-library.png--diagram-flowchart-example.png)
Compare 1

Reference point

Check 2 (audit)
-audit-flowcharts---vector-stencils-library.png--diagram-flowchart-example.png)
Compare 2

Event

Entity (Rounded Corners)
-audit-flowcharts---vector-stencils-library.png--diagram-flowchart-example.png)
Title Block
Condition

Input/ Output

Delay

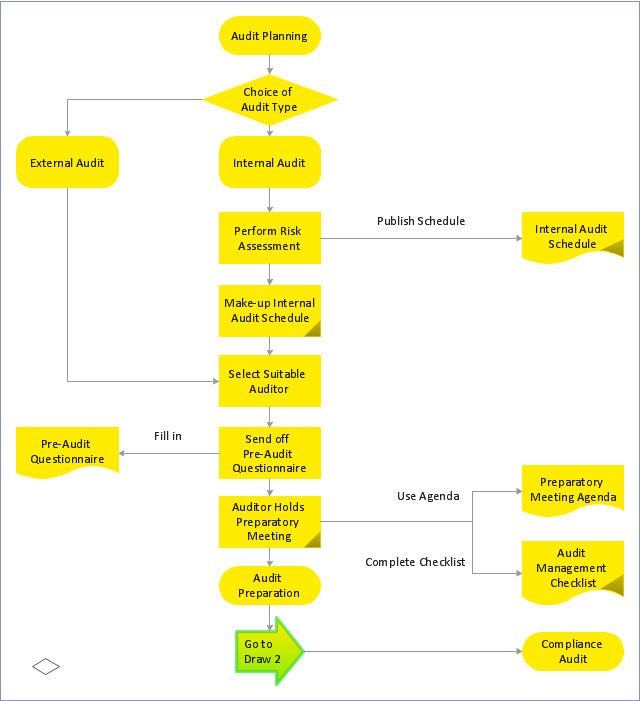
"Audit planning is a vital area of the audit primarily conducted at the beginning of audit process to ensure that appropriate attention is devoted to important areas, potential problems are promptly identified, work is completed expeditiously and work is properly coordinated. "Audit planning" means developing a general strategy and a detailed approach for the expected nature, timing and extent of the audit. The auditor plans to perform the audit in an efficient and timely manner. ...
An Audit plan is the specific guideline to be followed when conducting an audit. It helps the auditor obtain sufficient appropriate evidence for the circumstances, helps keep audit costs at a reasonable level, and helps avoid misunderstandings with the client.
It addresses the specifics of what, where, who, when and how:
What are the audit objectives?
Where will the audit be done? (i.e. scope)
When will the audit(s) occur? (how long?)
Who are the auditors?
How will the audit be done?" [Audit plan. Wikipedia]
The audit planning flowchart example was created using the ConceptDraw PRO diagramming and vector drawing software extended with the Audit Flowcharts solution from the Finance and Accounting area of ConceptDraw Solution Park.
www.conceptdraw.com/ solution-park/ finance-audit-flowcharts
Flowchart 1
Flowchart 2
"Project planning is part of project management, which relates to the use of schedules such as Gantt charts to plan and subsequently report progress within the project environment.
Initially, the project scope is defined and the appropriate methods for completing the project are determined. Following this step, the durations for the various tasks necessary to complete the work are listed and grouped into a work breakdown structure. Project planning is often used to organize different areas of a project, including project plans, work loads and the management of teams and individuals. The logical dependencies between tasks are defined using an activity network diagram that enables identification of the critical path. Float or slack time in the schedule can be calculated using project management software. Then the necessary resources can be estimated and costs for each activity can be allocated to each resource, giving the total project cost. At this stage, the project schedule may be optimized to achieve the appropriate balance between resource usage and project duration to comply with the project objectives. Once established and agreed, the project schedule becomes what is known as the baseline schedule. Progress will be measured against the baseline schedule throughout the life of the project. Analyzing progress compared to the baseline schedule is known as earned value management.
The inputs of the project planning phase include the project charter and the concept proposal. The outputs of the project planning phase include the project requirements, the project schedule, and the project management plan." [Project planning. Wikipedia]
The flow chart example "Project planning process" was created using the ConceptDraw PRO diagramming and vector drawing software extended with the Flowcharts solution from the area "What is a Diagram" of ConceptDraw Solution Park.
Flowchart - Project planning process

Flow Chart Symbols

This flow chart sample was drawn on the base on the illustration of the article "Climate change impact on China food security in 2050" from the website of Chinese Academy of Agricultural Sciences .
[caas.cn/ en/ newsroom/ research_ update/ 67347.shtml]
"Food security is a condition related to the ongoing availability of food. ...
According to the Food and Agriculture Organization (FAO), food security "exists when all people, at all times, have physical and economic access to sufficient, safe and nutritious food to meet their dietary needs and food preferences for an active and healthy life". ...
Extreme events, such as droughts and floods, are forecast to increase as climate change takes hold. Ranging from overnight floods to gradually worsening droughts, these will have a range of impacts on the agricultural sector. ...
According to the Climate & Development Knowledge Network report Managing Climate Extremes and Disasters in the Agriculture Sectors: Lessons from the IPCC SREX Report, the impacts will include changing productivity and livelihood patterns, economic losses, and impacts on infrastructure, markets and food security. Food security in future will be linked to our ability to adapt agricultural systems to extreme events." [Food security. Wikipedia]
The flowchart example "Food security assessment" was created using the ConceptDraw PRO diagramming and vector drawing software extended with the Flowcharts solution from the area "What is a Diagram" of ConceptDraw Solution Park.
Flowchart

"Product life cycle is a business analysis that attempts to identify a set of common stages in the life of commercial products. In other words the 'Product Life cycle' PLC is used to map the lifespan of the product such as the stages through which a product goes during its lifespan. ...
The stages of a product's life cycle... :
1. INTRODUCTION... 2. GROWTH... 3. MATURITY... 4. DECLINE...
The product life cycle is an important concept in marketing. It includes four stages that a product goes through from when it was first thought of until it is eliminated from the industry. Not all products reach this final stage. Some continue to grow and others rise and fall." [Product lifecycle. Wikipedia]
The flow chart example "Product life cycle process" was created using the ConceptDraw PRO diagramming and vector drawing software extended with the Flowcharts solution from the area "What is a Diagram" of ConceptDraw Solution Park.
Flowchart - Product life cycle process

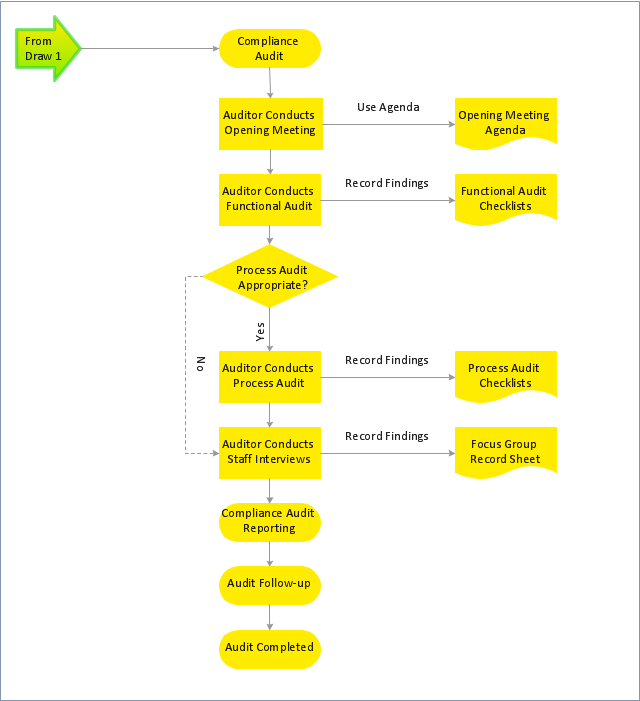
This audit flowchart sample was created on the base of the figure from the website of The California Department of Industrial Relations (DIR).
"Audit Process.
There are many steps in the audit process and during a number of these steps there is substantial opportunity to communicate with the audit staff to ask questions and participate in the audit process. ... a flow chart providing a visual picture of the sequence of events that occur in the audit process." [dir.ca.gov/ osip/ AuditUnit/ AuditProcess.html]
The flowchart example "Audit process" was created using the ConceptDraw PRO diagramming and vector drawing software extended with the Audit Flowcharts solution from the Finance and Accounting area of ConceptDraw Solution Park.
www.conceptdraw.com/ solution-park/ finance-audit-flowcharts
Audit flowchart

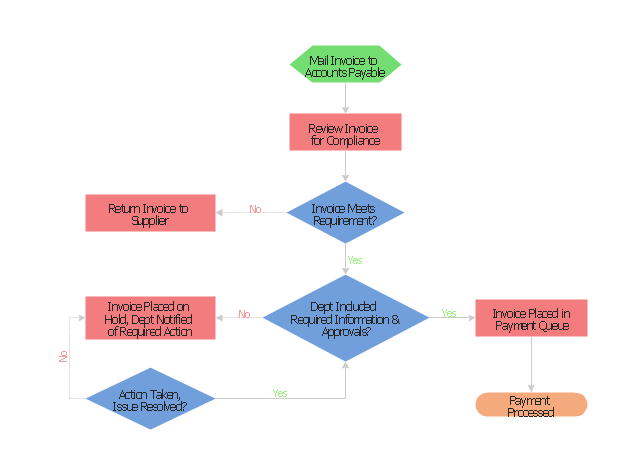
"An invoice, bill or tab is a commercial document issued by a seller to a buyer, relating to a sale transaction and indicating the products, quantities, and agreed prices for products or services the seller has provided the buyer.
Payment terms are usually stated on the invoice. These may specify that the buyer has a maximum number of days in which to pay, and is sometimes offered a discount if paid before the due date. The buyer could have already paid for the products or services listed on the invoice.
In the rental industry, an invoice must include a specific reference to the duration of the time being billed, so in addition to quantity, price and discount the invoicing amount is also based on duration. Generally each line of a rental invoice will refer to the actual hours, days, weeks, months, etc., being billed.
From the point of view of a seller, an invoice is a sales invoice. From the point of view of a buyer, an invoice is a purchase invoice. The document indicates the buyer and seller, but the term invoice indicates money is owed or owing. ...
Payment of invoices.
Organizations purchasing goods and services usually have a process in place for approving payment of invoices based on an employee's confirmation that the goods or services have been received.
Typically, when paying an invoice, a remittance advice will be sent to the supplier to inform them their invoice has been paid." [Invoice. Wikipedia]
The flow chart example "Invoice payment process" was created using the ConceptDraw PRO diagramming and vector drawing software extended with the Flowcharts solution from the area "What is a Diagram" of ConceptDraw Solution Park.
Flowchart - Invoice payment process
"Human resource management (HRM, or simply HR) is the management process of an organization's workforce, or human resources. It is responsible for the attraction, selection, training, assessment, and rewarding of employees, while also overseeing organizational leadership and culture and ensuring compliance with employment and labor laws. In circumstances where employees desire and are legally authorized to hold a collective bargaining agreement, HR will also serve as the company's primary liaison with the employees' representatives (usually a trades union).
HR is a product of the human relations movement of the early 20th century, when researchers began documenting ways of creating business value through the strategic management of the workforce. The function was initially dominated by transactional work, such as payroll and benefits administration, but due to globalization, company consolidation, technological advancement, and further research, HR now focuses on strategic initiatives like mergers and acquisitions, talent management, succession planning, industrial and labor relations, and diversity and inclusion." [Human resource management. Wikipedia]
The flow chart example "HR management process" was created using the ConceptDraw PRO diagramming and vector drawing software extended with the Flowcharts solution from the area "What is a Diagram" of ConceptDraw Solution Park.
Flowchart - HR management process
"An import is a good brought into a jurisdiction, especially across a national border, from an external source. The purchaser of the exotic good is called an importer. An import in the receiving country is an export from the sending country. Importation and exportation are the defining financial transactions of international trade.
In international trade, the importation and exportation of goods are limited by import quotas and mandates from the customs authority. The importing and exporting jurisdictions may impose a tariff (tax) on the goods. In addition, the importation and exportation of goods are subject to trade agreements between the importing and exporting jurisdictions." [Import. Wikipedia]
The flow chart example "Import process" was created using the ConceptDraw PRO diagramming and vector drawing software extended with the Flowcharts solution from the area "What is a Diagram" of ConceptDraw Solution Park.
Flowchart - Import process
This cross-functional flowchart sample represents the payroll process mapping.
"Business process mapping refers to activities involved in defining what a business entity does, who is responsible, to what standard a business process should be completed, and how the success of a business process can be determined.
The main purpose behind business process mapping is to assist organizations in becoming more efficient. A clear and detailed business process map or diagram allows outside firms to come in and look at whether or not improvements can be made to the current process.
Business process mapping takes a specific objective and helps to measure and compare that objective alongside the entire organization's objectives to make sure that all processes are aligned with the company's values and capabilities.
ISO 9001 requires a business entity to follow a process approach when managing its business, and to this end creating business process maps will assist. The entity can then work towards ensuring its processes are effective (the right process is followed the first time), and efficient (continually improved to ensure processes use the smallest amount of resources)." [Business process mapping. Wikipedia]
The business process map example "Swim lane diagram - Payroll process mapping" was drawn using the ConceptDraw PRO diagramming and vector drawing software extended with the Cross-Functional Flowcharts solution from the Business Processes area of ConceptDraw Solution Park.
"Business process mapping refers to activities involved in defining what a business entity does, who is responsible, to what standard a business process should be completed, and how the success of a business process can be determined.
The main purpose behind business process mapping is to assist organizations in becoming more efficient. A clear and detailed business process map or diagram allows outside firms to come in and look at whether or not improvements can be made to the current process.
Business process mapping takes a specific objective and helps to measure and compare that objective alongside the entire organization's objectives to make sure that all processes are aligned with the company's values and capabilities.
ISO 9001 requires a business entity to follow a process approach when managing its business, and to this end creating business process maps will assist. The entity can then work towards ensuring its processes are effective (the right process is followed the first time), and efficient (continually improved to ensure processes use the smallest amount of resources)." [Business process mapping. Wikipedia]
The business process map example "Swim lane diagram - Payroll process mapping" was drawn using the ConceptDraw PRO diagramming and vector drawing software extended with the Cross-Functional Flowcharts solution from the Business Processes area of ConceptDraw Solution Park.
Cross-functional flowchart
"The general definition of an audit is a planned and documented activity performed by qualified personnel to determine by investigation, examination, or evaluation of objective evidence, the adequacy and compliance with established procedures, or applicable documents, and the effectiveness of implementation. The term may refer to audits in accounting, internal controls, quality management, project management, water management, and energy conservation.
Auditing is defined as a systematic and independent examination of data, statements, records, operations and performances (financial or otherwise) of an enterprise for a stated purpose. In any auditing the auditor perceives and recognizes the propositions before him for examination, collects evidence, evaluates the same and on this basis formulates his judgment which is communicated through his audit report. The purpose is then to give an opinion on the adequacy of controls (financial and otherwise) within an environment they audit, to evaluate and improve the effectiveness of risk management, control, and governance processes." [Audit. Wikipedia]
The audit flowchart example "Audit process flowchart" was created using the ConceptDraw PRO diagramming and vector drawing software extended with the Audit Flowcharts solution from the Finance and Accounting area of ConceptDraw Solution Park.
Auditing is defined as a systematic and independent examination of data, statements, records, operations and performances (financial or otherwise) of an enterprise for a stated purpose. In any auditing the auditor perceives and recognizes the propositions before him for examination, collects evidence, evaluates the same and on this basis formulates his judgment which is communicated through his audit report. The purpose is then to give an opinion on the adequacy of controls (financial and otherwise) within an environment they audit, to evaluate and improve the effectiveness of risk management, control, and governance processes." [Audit. Wikipedia]
The audit flowchart example "Audit process flowchart" was created using the ConceptDraw PRO diagramming and vector drawing software extended with the Audit Flowcharts solution from the Finance and Accounting area of ConceptDraw Solution Park.
Audit Process Flowchart
Section 1
Section 2
HelpDesk
Software for Flowchart Diagrams

- | Definition Of Terminator In Flowchart
- Flowchart - Vector stencils library | Flow Chart Symbols For ...
- Flow Chart Symbols | Terminator In The Flow Chart
- Basic Flowchart Symbols and Meaning | Audit Flowchart Symbols ...
- How to Create Flowchart Using Standard Flowchart Symbols ...
- Basic Flowchart Symbols and Meaning | Elements Of Flowchart In ...
- Terminator Technology Mechanism Flowchart
- Food security assessment | Flowchart System Of Terminator
- Payroll process | Software for Flowchart Diagrams
- Terminator Symbol In Computer Science