Flow Chart Symbols

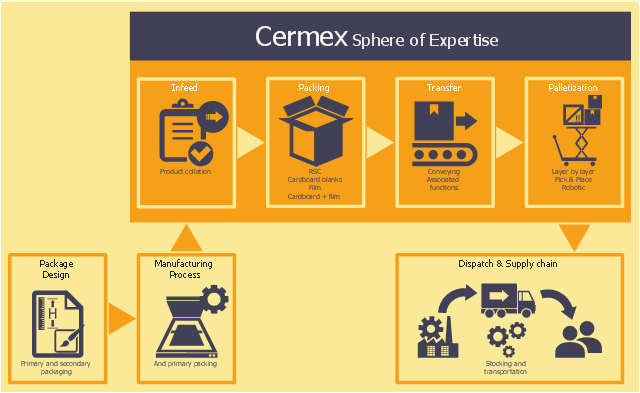
This logistic flow chart sample shows the Cermex sphere of expertise.
It was designed on the base of the Wikimedia Commons file: End of Line drawing.jpg.
[commons.wikimedia.org/ wiki/ File:End_ of_ Line_ drawing.jpg]
This file is licensed under the Creative Commons Attribution-Share Alike 3.0 Unported license. [creativecommons.org/ licenses/ by-sa/ 3.0/ deed.en]
"Cermex is a company that manufactures case packing, shrink-wrapping and palletizing machinery. Cermex supplies engineering and equipment to automate end of line packaging, from the packed product to the loaded pallet. Cermex supports global engineering and equipment for the packaging of various and diverse products, from individual product packaging to completing finished pallets for shipment." [Cermex. Wikipedia]
The logistic flowchart example "End of Line drawing" was created using ConceptDraw PRO diagramming and vector drawing software extended with the Logistics Flow Charts solution from the Business Processes area of ConceptDraw Solution Park.
Logistic flowchart
 Logistics Flow Charts
Logistics Flow Charts solution extends ConceptDraw DIAGRAM functionality with opportunities of powerful logistics management software. It provides large collection of predesigned vector logistic symbols, pictograms, objects and clipart to help you design with pleasure Logistics flow chart, Logistics process flow diagram, Inventory flow chart, Warehouse flowchart, Warehouse management flow chart, Inventory control flowchart, or any other Logistics diagram. Use this solution for logistics planning, to reflect logistics activities and processes of an enterprise or firm, to depict the company's supply chains, to demonstrate the ways of enhancing the economic stability on the market, to realize logistics reforms and effective products' promotion.
Basic of Flowchart: Meaning and Symbols


"In mathematics, the Euclidean algorithm, or Euclid's algorithm, is a method for computing the greatest common divisor (GCD) of two (usually positive) integers, also known as the greatest common factor (GCF) or highest common factor (HCF). ...
The GCD of two positive integers is the largest integer that divides both of them without leaving a remainder (the GCD of two integers in general is defined in a more subtle way).
In its simplest form, Euclid's algorithm starts with a pair of positive integers, and forms a new pair that consists of the smaller number and the difference between the larger and smaller numbers. The process repeats until the numbers in the pair are equal. That number then is the greatest common divisor of the original pair of integers.
The main principle is that the GCD does not change if the smaller number is subtracted from the larger number. ... Since the larger of the two numbers is reduced, repeating this process gives successively smaller numbers, so this repetition will necessarily stop sooner or later - when the numbers are equal (if the process is attempted once more, one of the numbers will become 0)." [Euclidean algorithm. Wikipedia]
The flowchart example "Euclidean algorithm" was created using the ConceptDraw PRO diagramming and vector drawing software extended with the Mathematics solution from the Science and Education area of ConceptDraw Solution Park.
Euclid's algorithm flow chart

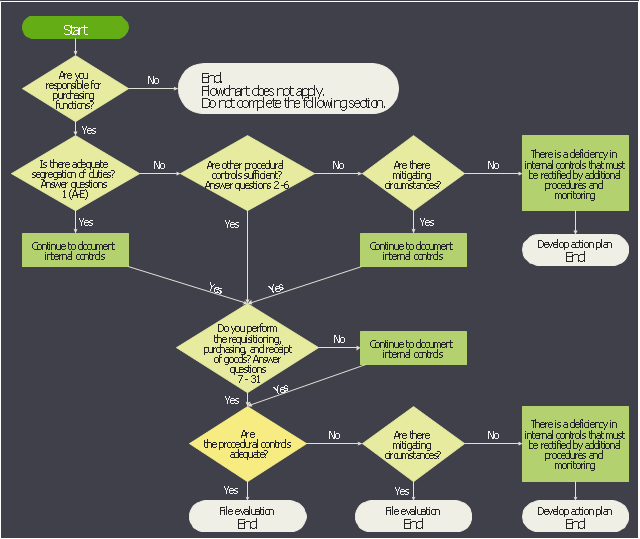
This accounting flowchart example was created on the base of the figure from the website of the Office of the State Comptroller. [osc.ct.gov/ manuals/ acctdirect/ question03.htm]
"Purchasing is the formal process of buying goods and services. The purchasing process can vary from one organization to another, but there are some common key elements.
The process usually starts with a demand or requirements – this could be for a physical part (inventory) or a service. A requisition is generated, which details the requirements (in some cases providing a requirements speciation) which actions the procurement department. A request for proposal (RFP) or request for quotation (RFQ) is then raised. Suppliers send their quotations in response to the RFQ, and a review is undertaken where the best offer (typically based on price, availability and quality) is given the purchase order." [Purchasing process. Wikipedia]
The accounting flowchart example "Purchasing flowchart" was created using the ConceptDraw PRO software extended with the Accounting Flowcharts solution from the Finance and Accounting area of ConceptDraw Solution Park.
Accounting flowchart
Process Flowchart


Cross Functional Flowchart Symbols

The vector stencils library "Flowchart" contains 26 symbols for drawing the flow charts using the ConceptDraw PRO diagramming and vector drawing software.
"Flowcharts are used in designing and documenting complex processes or programs. Like other types of diagrams, they help visualize what is going on and thereby help the viewer to understand a process, and perhaps also find flaws, bottlenecks, and other less-obvious features within it. There are many different types of flowcharts, and each type has its own repertoire of boxes and notational conventions. The two most common types of boxes in a flowchart are:
(1) a processing step, usually called activity, and denoted as a rectangular box;
(2) a decision, usually denoted as a diamond.
A flowchart is described as "cross-functional" when the page is divided into different swimlanes describing the control of different organizational units. A symbol appearing in a particular "lane" is within the control of that organizational unit. This technique allows the author to locate the responsibility for performing an action or making a decision correctly, showing the responsibility of each organizational unit for different parts of a single process. ...
Common alternate names include: flowchart, process flowchart, functional flowchart, process map, process chart, functional process chart, business process model, process model, process flow diagram, work flow diagram, business flow diagram. The terms "flowchart" and "flow chart" are used interchangeably." [Flowchart. Wikipedia]
The example "Design elements - Flowchart" is included in the Flowcharts solution from the area "What is a Diagram" of ConceptDraw Solution Park.
Flowchart notation

This flow chart sample was drawn on the base on the illustration of the article "Climate change impact on China food security in 2050" from the website of Chinese Academy of Agricultural Sciences .
[caas.cn/ en/ newsroom/ research_ update/ 67347.shtml]
"Food security is a condition related to the ongoing availability of food. ...
According to the Food and Agriculture Organization (FAO), food security "exists when all people, at all times, have physical and economic access to sufficient, safe and nutritious food to meet their dietary needs and food preferences for an active and healthy life". ...
Extreme events, such as droughts and floods, are forecast to increase as climate change takes hold. Ranging from overnight floods to gradually worsening droughts, these will have a range of impacts on the agricultural sector. ...
According to the Climate & Development Knowledge Network report Managing Climate Extremes and Disasters in the Agriculture Sectors: Lessons from the IPCC SREX Report, the impacts will include changing productivity and livelihood patterns, economic losses, and impacts on infrastructure, markets and food security. Food security in future will be linked to our ability to adapt agricultural systems to extreme events." [Food security. Wikipedia]
The flowchart example "Food security assessment" was created using the ConceptDraw PRO diagramming and vector drawing software extended with the Flowcharts solution from the area "What is a Diagram" of ConceptDraw Solution Park.
Flowchart

Flowchart

How to Draw a Flowchart

Technical Flow Chart

Flow chart ExampleWarehouse Flowchart


Examples of Flowchart


Flowchart Software

HelpDesk
How to Create Flowchart Using Standard Flowchart Symbols

Cisco IBM. Cisco icons, shapes, stencils and symbols

Samples of Flowcharting

- Process Flowchart | End To End Flow Diagram
- Design elements - Flowchart | Euclidean algorithm - Flowchart ...
- Design elements - Flowchart | Is Processing Box Is Used At The End ...
- Design elements | Symbols Used For Start And End In Flow Diagram
- Design elements - Process flowchart | Start Or End Box Used In ...
- How to Create Flowchart Using Standard Flowchart Symbols ...
- Procurement process mapping | Purchasing flowchart
- Use Of Start End Box In Flowchart
- How to Remove ConceptDraw Products from Mac and PC | Process ...
- Logistics Flow Charts | Logistics | Logistics End To End Flow