The FTA diagram sample "Fault tree analysis - Insulin delivery system" was redesigned from the illustration of "CMSI 641: Introduction to Software Engineering. Design of Critical Systems. B.J. Johnson. 2005. Loyola Marymount University".
"Another way of assessing hazards is using fault tree analysis. In this process, each of the identified hazards is covered by a detailed analysis to find out what might cause it. Either inductive or deductive reasoning is applied. In the case of software hazards, the usual focus is to determine faults that will cause the system to fail to deliver a system service, such as a monitoring system. A "fault tree" is constructed to link all the possible situations together, to help identify the interrelationships of the failures, which modules may cause them, and what "trickle-down effects" there might be. Here is an example of a fault tree, as applied to the Insulin delivery system from Sommerville...
Note that this tree is only partially complete, since only the potential software faults are shown on the diagram. The potential failures involving hardware, such as low battery, blood monitor or sensor failure, patient over-exertion or inattention, or medical staff failure are noticeable by their absence.
The fault tree and safety specification processes are two ways of helping with system risk assessment tasks. Once the risks are identified, there are other assessments that need to take place. First, the likelihood of the risk occurrance must be assessed. This is often quantifiable, so numbers may be assigned based on things like MTBF, latency effects, and other known entities. There may be other non-quantifiable contributors to the risk likelihood, however, such that these must be assessed and estimated by experts in the domain. (Don't short-change this process when dealing with critical systems!) Finally, the risk assessment must include the severity of the risk, meaning an estimation of the cost to the project in the event the risk item actually does occur. "Cost to the project" means all associated costs, including schedule delays, human injury, damage to hardware, corruption of data, and so on."
[myweb.lmu.edu/ bjohnson/ cmsi641web/ week15-2.html]
The FTA diagram example "Fault tree analysis - Insulin delivery system" was created using the ConceptDraw PRO diagramming and vector drawing software extended with the Fault Tree Analysis Diagrams solution from the Engineering area of ConceptDraw Solution Park.
FTA diagram

This example was redesigned from the Wikimedia Commons file: Example of High Level Fault Tree.jpg. [commons.wikimedia.org/ wiki/ File:Example_ of_ High_ Level_ Fault_ Tree.jpg]
"Risk assessment is the determination of quantitative or qualitative value of risk related to a concrete situation and a recognized threat (also called hazard). Quantitative risk assessment requires calculations of two components of risk (R):, the magnitude of the potential loss (L), and the probability (p) that the loss will occur. Acceptable risk is a risk that is understood and tolerated usually because the cost or difficulty of implementing an effective countermeasure for the associated vulnerability exceeds the expectation of loss.
In all types of engineering of complex systems sophisticated risk assessments are often made within Safety engineering and Reliability engineering when it concerns threats to life, environment or machine functioning. The nuclear, aerospace, oil, rail and military industries have a long history of dealing with risk assessment. Also, medical, hospital, social service and food industries control risks and perform risk assessments on a continual basis. Methods for assessment of risk may differ between industries and whether it pertains to general financial decisions or environmental, ecological, or public health risk assessment." [Risk assessment. Wikipedia]
The FTA diagram example "High level fault tree" was created using the ConceptDraw PRO diagramming and vector drawing software extended with the Fault Tree Analysis Diagrams solution from the Engineering area of ConceptDraw Solution Park.
FTA diagram

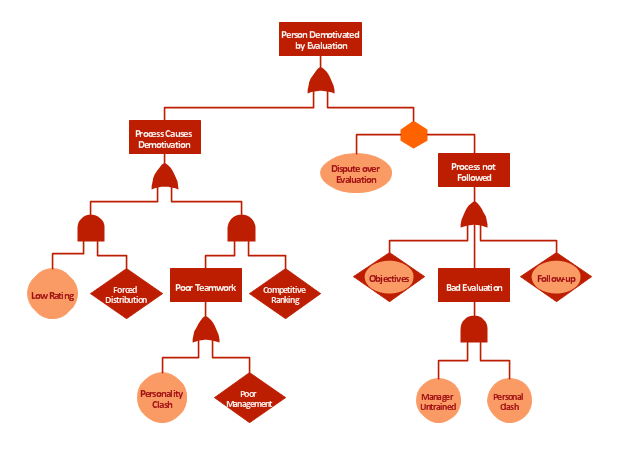
"Subjective performance evaluation allows the use of a subtler, more balanced assessment of employee performance, and is typically used for more complex jobs where comprehensive objective measures are difficult to specify and/ or measure. Whilst often the only feasible method, the attendant problems with subjective performance evaluation have resulted in a variety of incentive structures and supervisory schemes. One problem, for example, is that supervisors may under-report performance in order to save on wages, if they are in some way residual claimants, or perhaps rewarded on the basis of cost savings. This tendency is of course to some extent offset by the danger of retaliation and/ or demotivation of the employee, if the supervisor is responsible for that employee’s output. ...
Another problem relates to what is known as the "compression of ratings". Two related influences—centrality bias, and leniency bias—have been documented ... The former results from supervisors being reluctant to distinguish critically between workers (perhaps for fear of destroying team spirit), while the latter derives from supervisors being averse to offering poor ratings to subordinates, especially where these ratings are used to determine pay, not least because bad evaluations may be demotivating rather than motivating. However, these biases introduce noise into the relationship between pay and effort, reducing the incentive effect of performance-related pay. ... this is the reason for the common separation of evaluations and pay, with evaluations primarily used to allocate training.
Finally, while the problem of compression of ratings originates on the supervisor-side, related effects occur when workers actively attempt to influence the appraisals supervisors give, either by influencing the performance information going to the supervisor: multitasking (focussing on the more visibly productive activities...), or by working “too hard” to signal worker quality or create a good impression...; or by influencing the evaluation of it, e.g., by "currying influence"... or by outright bribery..." [Principal–agent problem. Wikipedia]
The example "Person demotivated by evaluation - Fault tree analysis diagram" was created using the ConceptDraw PRO diagramming and vector drawing software extended with the Fault Tree Analysis Diagrams solution from the Engineering area of ConceptDraw Solution Park.
FTA diagram
SDL Flowchart Symbols

 Specification and Description Language (SDL)
For people in the field of systems engineering or system design, working with specification and description language (sdl) and finite state machines (fsm).
 Bar Graphs
The Bar Graphs solution enhances ConceptDraw PRO v10 functionality with templates, numerous professional-looking samples, and a library of vector stencils for drawing different types of Bar Graphs, such as Simple Bar Graph, Double Bar Graph, Divided Bar Graph, Horizontal Bar Graph, Vertical Bar Graph, and Column Bar Chart.
 Circle-Spoke Diagrams
Examples of subject areas that are well suited to this approach are marketing, business, products promotion, process modeling, market, resource, time, and cost analysis. Circle-Spoke Diagrams are successfully used in presentations, conferences, management documents, magazines, reportages, reviews, reports, TV, and social media.
 Health Food
The Health Food solution contains the set of professionally designed samples and large collection of vector graphic libraries of healthy foods symbols of fruits, vegetables, herbs, nuts, beans, seafood, meat, dairy foods, drinks, which give powerful possi
 Bubble Diagrams
Bubble diagrams have enjoyed great success in software engineering, architecture, economics, medicine, landscape design, scientific and educational process, for ideas organization during brainstorming, for making business illustrations, presentations, planning, design, and strategy development. They are popular because of their simplicity and their powerful visual communication attributes.
 25 Typical Orgcharts
The 25 Typical Orgcharts solution contains powerful organizational structure and organizational management drawing tools, a variety of professionally designed organization chart and matrix organization structure samples, 25 templates based on various orga
 Education Package
Education Package is a comprehensive set of multifarious graphical solutions from ConceptDraw Solution Park, collected together in help to ConceptDraw PRO users working in a field of science, education and training, which is aimed at improving the quality of education and helping to design with ease variety of interesting and colorful educational materials, diagrams, charts and maps. Use it to present the information and knowledge in an interesting, clear, structured and simple form to achieve a success in education and pedagogy, to maintain the interest of students and pupils throughout the whole learning process, at the lectures, lessons and even during independent work with additional materials, to contribute to better perception of scientific information by listeners during the conferences and reports.
 Astronomy
Astronomy solution extends ConceptDraw PRO software with illustration and sketching software with templates, samples and libraries of a variety of astronomy symbols, including constellations, galaxies, stars, and planet vector shapes; a whole host of cele
 Entity-Relationship Diagram (ERD)
An Entity-Relationship Diagram (ERD) is a visual presentation of entities and relationships. That type of diagrams is often used in the semi-structured or unstructured data in databases and information systems. At first glance ERD is similar to a flowch
- Fault Tree Analysis Diagrams | PROBLEM ANALYSIS. Root Cause ...
- FTA diagram - Hazard analysis | Design elements - Fault tree ...
- Fault Tree Analysis Examples And Solutions
- Fault tree analysis - Insulin delivery system | High level fault tree ...
- Fault Tree Analysis Software
- Fault tree analysis - Insulin delivery system | Patients Safety Tree ...
- Process Flowchart | Types of Flowcharts | Flow chart Example ...
- Fault tree analysis - Insulin delivery system | Process Flowchart ...
- Fault Tree Analysis Diagrams | Design elements - Fault tree analysis ...
- FTA diagram - Hazard analysis | Fault tree analysis - Insulin delivery ...
- Fault Tree Analysis Software | Design elements - Fault tree analysis ...
- Engineering Fault Tree Analysis Diagrams
- Fault Tree Analysis Diagrams | ConceptDraw Solution Park | Cafe ...
- Safety Fault Tree Analysis Example
- IDEF0 Diagrams | Basic Flowchart Symbols and Meaning | IDEF0 ...
- Fault Tree Analysis Diagrams | Fault Tree Analysis Example | Fault ...
- Fault Tree Analysis Software | How to Create a Fault Tree Analysis ...
- Design elements - Fault tree analysis diagrams | Fault Tree Analysis ...
- Fault Tree Analysis Diagrams | High level fault tree | Network Printer ...
- Event Tree Analysis Example Problem