"Automobile air conditioning systems cool the occupants of a vehicle in hot weather, and have come into wide use from the late twentieth century. Air conditioners use significant power; on the other hand the drag of a car with closed windows is less than if the windows are open to cool the occupants evaporatively. There has been much debate on the effect of air conditioning on the fuel efficiency of a vehicle. Factors such as wind resistance, aerodynamics and engine power and weight have to be factored into finding the true variance between using the air conditioning system and not using it when estimating the actual fuel mileage. Other factors on the impact on the engine and an overall engine heat increase can have an impact on the cooling system of the vehicle." [Automobile air conditioning. Wikipedia]
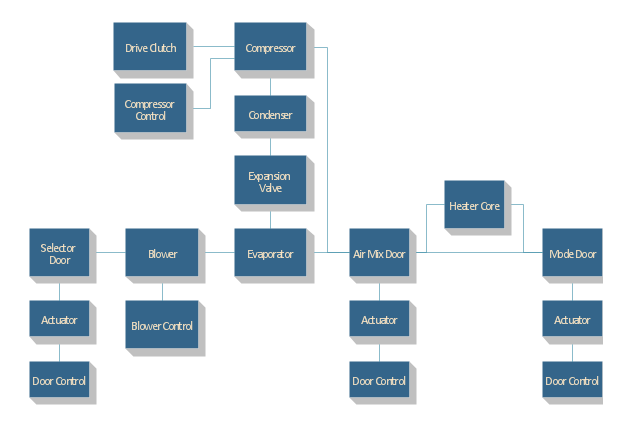
The block diagram example "Automotive HVAC system" was created using the ConceptDraw PRO diagramming and vector drawing software extended with the Block Diagrams solution from the area "What is a Diagram" of ConceptDraw Solution Park.
The block diagram example "Automotive HVAC system" was created using the ConceptDraw PRO diagramming and vector drawing software extended with the Block Diagrams solution from the area "What is a Diagram" of ConceptDraw Solution Park.
Automotive HVAC system
HelpDesk
How to Create an ERD Diagram
 using Chen's notation")
"Dimensions of service quality.
A customer's expectation of a particular service is determined by factors such as recommendations, personal needs and past experiences. The expected service and the perceived service sometimes may not be equal, thus leaving a gap. The service quality model or the ‘GAP model’ developed by a group of authors- Parasuraman, Zeithaml and Berry at Texas and North Carolina in 1985 , highlights the main requirements for delivering high service quality. It identifies five ‘gaps’ that cause unsuccessful delivery. Customers generally have a tendency to compare the service they 'experience' with the service they 'expect' . If the experience does not match the expectation , there arises a gap. Ten determinants that may influence the appearance of a gap were described by Parasuraman, Zeithaml and Berry. in the SERVQUAL model: reliability, responsiveness, competence, access, courtesy, communication, credibility, security, understanding the customer and tangibles.
Later, the determinants were reduced to five: tangibles; reliability; responsiveness; service assurance and empathy in the so called RATER model." [Service quality. Wikipedia]
The block diagram example "Gap model of service quality" was created using the ConceptDraw PRO diagramming and vector drawing software extended with the Block Diagrams solution from the area "What is a Diagram" of ConceptDraw Solution Park.
Block diagram

Draw Diagram on Mac

HelpDesk
How to Draw a Fishbone Diagram with ConceptDraw PRO

 Network Layout Floor Plans
Network Layout Floor Plans solution extends ConceptDraw PRO software functionality with powerful tools for quick and efficient documentation the network equipment and displaying its location on the professionally designed Network Layout Floor Plans. Never before creation of Network Layout Floor Plans, Network Communication Plans, Network Topologies Plans and Network Topology Maps was not so easy, convenient and fast as with predesigned templates, samples, examples and comprehensive set of vector design elements included to the Network Layout Floor Plans solution. All listed types of plans will be a good support for the future correct cabling and installation of network equipment.
- Factors To Consider In Drawing Of Block Diagram
- Factors Of A Good Block Diagram
- Block diagram - Gap model of service quality | Parasuraman Drawings
- Basic Diagramming | Functional Block Diagram | The Best Drawing ...
- Factors Of Good Block
- Factors That Enhance Good Block Diagram
- UML Block Diagram | Block Diagrams | How to Draw a Block ...
- Draw The Block Diagram Of The Cooling System Of The Air
- A Sketch Of An Engine Block Diagram
- Important Factors That Will Enhance Good Schematic Diagram
- Decision Making | Workflow Diagram | Block diagram - Customer ...
- Block diagram - Porter's five forces model
- Block diagram - Types of individual behavior in organization | Block ...
- Relations diagram - Health care | Functional Block Diagram | Cross ...
- Block diagram - Automotive HVAC system | Functional Block ...
- Process Flowchart | Block Diagram Creator | The Best Drawing ...
- Block diagram - Gap model of service quality | Block Diagram ...
- Simple Drawing Applications for Mac | Best Multi-Platform Diagram ...
- CS Odessa Announces Cisco™ Network Diagrams Solution to ...