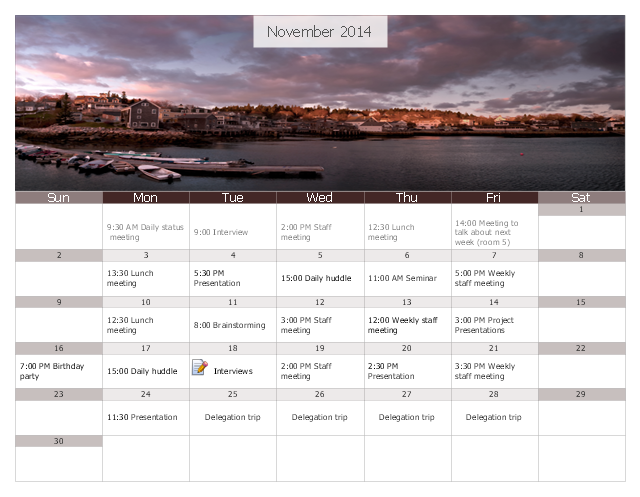
"Wall calendars can serve as reminders of holidays, important events, and company events. They typically consist of a collection of images (one per month) on a given subject.
Example subjects include automobiles, wildlife, male or female models, etc." [Wall calendar. Wikipedia]
The month calendar sample was created using the ConceptDraw PRO diagramming and vector drawing software extended with the Calendars solution from the Management area of ConceptDraw Solution Park.
Example subjects include automobiles, wildlife, male or female models, etc." [Wall calendar. Wikipedia]
The month calendar sample was created using the ConceptDraw PRO diagramming and vector drawing software extended with the Calendars solution from the Management area of ConceptDraw Solution Park.
Calendar
 Time Series Dashboard
Time series dashboard solution extends ConceptDraw PRO software with templates, samples and vector stencils libraries with charts, graphs and plots for drawing the visual dashboards showing data time series.
 Cross-Functional Flowcharts
Cross-functional flowcharts are powerful and useful tool for visualizing and analyzing complex business processes which requires involvement of multiple people, teams or even departments. They let clearly represent a sequence of the process steps, the order of operations, relationships between processes and responsible functional units (such as departments or positions).
 Business and Finance
Use Business and Finance solution to make professional-looking documents, presentations and websites, business, finance, advertising, and project management illustrations, or any designs that requires clipart of currency, office, business, advertising, management, marketing, people, time, post, contacts, collaboration, etc.
 Event-driven Process Chain Diagrams
Event-driven Process Chain (EPC) Diagram is a type of flowchart widely used for modeling in business engineering and reengineering, business process improvement, and analysis. EPC method was developed within the Architecture of Integrated Information Systems (ARIS) framework.
"A chart can take a large variety of forms, however there are common features that provide the chart with its ability to extract meaning from data.
Typically the data in a chart is represented graphically, since humans are generally able to infer meaning from pictures quicker than from text. Text is generally used only to annotate the data.
One of the more important uses of text in a graph is the title. A graph's title usually appears above the main graphic and provides a succinct description of what the data in the graph refers to.
Dimensions in the data are often displayed on axes. If a horizontal and a vertical axis are used, they are usually referred to as the x-axis and y-axis respectively. Each axis will have a scale, denoted by periodic graduations and usually accompanied by numerical or categorical indications. Each axis will typically also have a label displayed outside or beside it, briefly describing the dimension represented. If the scale is numerical, the label will often be suffixed with the unit of that scale in parentheses. ...
Within the graph a grid of lines may appear to aid in the visual alignment of data. The grid can be enhanced by visually emphasizing the lines at regular or significant graduations. The emphasized lines are then called major grid lines and the remainder are minor grid lines.
The data of a chart can appear in all manner of formats, and may include individual textual labels describing the datum associated with the indicated position in the chart. The data may appear as dots or shapes, connected or unconnected, and in any combination of colors and patterns. Inferences or points of interest can be overlaid directly on the graph to further aid information extraction.
When the data appearing in a chart contains multiple variables, the chart may include a legend (also known as a key). A legend contains a list of the variables appearing in the chart and an example of their appearance. This information allows the data from each variable to be identified in the chart." [Chart. Wikipedia]
The vector stencils library "Time series charts" contains 10 templates: 3 column charts, 3 bar charts, 2 line graphs and 2 dot plots. All these charts are Live Objects displaying the data from external data source files.
Use these chart templates to design your business performance digital dashboards using the ConceptDraw PRO diagramming and vector drawing software.
The example "Design elements - Time series charts" is included in the Time Series Dashboard solution from the area "What is a Dashboard" of ConceptDraw Solution Park.
Time series charts

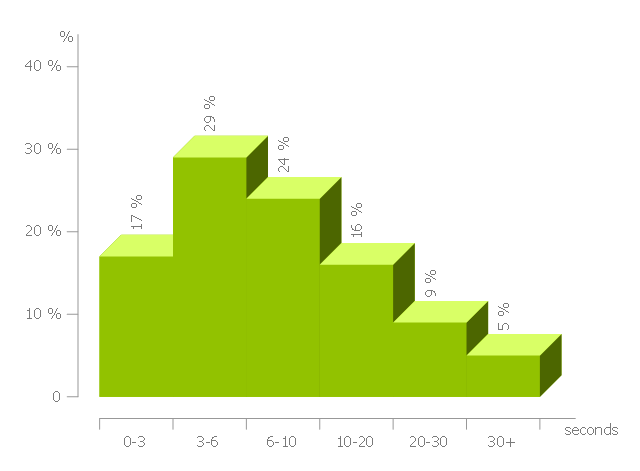
This histogram sample shows the frequency distribution of web page load time.
"Web performance optimization, WPO, or website optimization is the field of knowledge about increasing the speed in which web pages are downloaded and displayed on the user's web browser. ...
With the average internet speed now increasing globally, it's fitting for website administrators and "webmasters" to consider the time it takes for websites to render for the visitor.
Faster website download speeds have been shown to increase visitor retention and loyalty and user satisfaction, especially for users with slow internet connections and those on mobile devices. Web performance also leads to less data travelling across the web, which in turn lowers a website's power consumption and environmental impact. Some aspects which can affect the speed of page load include Browser/ Server Cache, Image Optimization and also encryption (for example SSL), which can affect the time it takes for pages to render." [Web performance optimization. Wikipedia]
The histogram example "Page load time" was created using the ConceptDraw PRO diagramming and vector drawing software extended with the Histograms solution from the Graphs and Charts area of ConceptDraw Solution Park.
Histogram
 Interactive Voice Response Diagrams
Interactive Voice Response Diagrams solution extends ConceptDraw PRO v10 software with samples, templates and libraries of ready-to-use vector stencils that help create Interactive Voice Response (IVR) diagrams illustrating in details a work of interactive voice response system, the IVR system’s logical and physical structure, Voice-over-Internet Protocol (VoIP) diagrams, and Action VoIP diagrams with representing voice actions on them, to visualize how the computers interact with callers through voice recognition and dual-tone multi-frequency signaling (DTMF) keypad inputs.
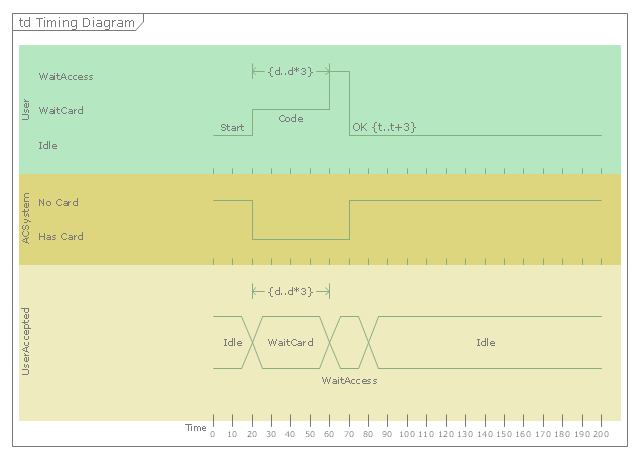
"A timing diagram in the Unified Modeling Language 2.0 is a specific type of interaction diagram, where the focus is on timing constraints.
Timing diagrams are used to explore the behaviors of objects throughout a given period of time. A timing diagram is a special form of a sequence diagram. The differences between timing diagram and sequence diagram are the axes are reversed so that the time is increased from left to right and the lifelines are shown in separate compartments arranged vertically.
There are two basic flavors of timing diagram: the concise notation, and the robust notation." [Timing diagram (Unified Modeling Language). Wikipedia]
This UML timing diagram example was created using the ConceptDraw PRO diagramming and vector drawing software extended with the Rapid UML solution from the Software Development area of ConceptDraw Solution Park.
UML timing diagram
- Business calendar example | Monthly calendar template | PM ...
- Seven Management and Planning Tools | Total Quality Management ...
- Examples of Flowcharts, Org Charts and More | Business calendar ...
- Seven Management and Planning Tools | Design elements ...
- Business calendar example | Examples of Flowcharts, Org Charts ...
- Chart Examples | Line Chart Examples | Examples of Flowcharts ...
- Business calendar example | Business Processes | Calendars |
- Business calendar example | Month calendar example | Examples of ...
- Time Series Dashboard | Line Chart Examples | PM Personal Time ...
- Business and Finance Illustrations Example
- Example Process Flow | Accounting Flowcharts | Business process ...
- Column Chart Software | How to Create a Column Chart | Bar Chart ...
- Seven Management and Planning Tools | Schedule pie chart - Daily ...
- Flowchart Process Example | Pyramid Chart Examples | Business ...
- Business and Finance Illustrations Example - Conceptdraw.com
- Chart Examples | Pie Chart Examples | Line Chart Examples |
- PM Teams | PM Personal Time Management | PM Easy |
- IVR time auto-attendant diagram
- Example Process Flow | Accounting Flowcharts | Best Program to ...
- Flowchart Example : Flow Chart of Marketing Analysis | Cross ...