Fault Tree Analysis Software
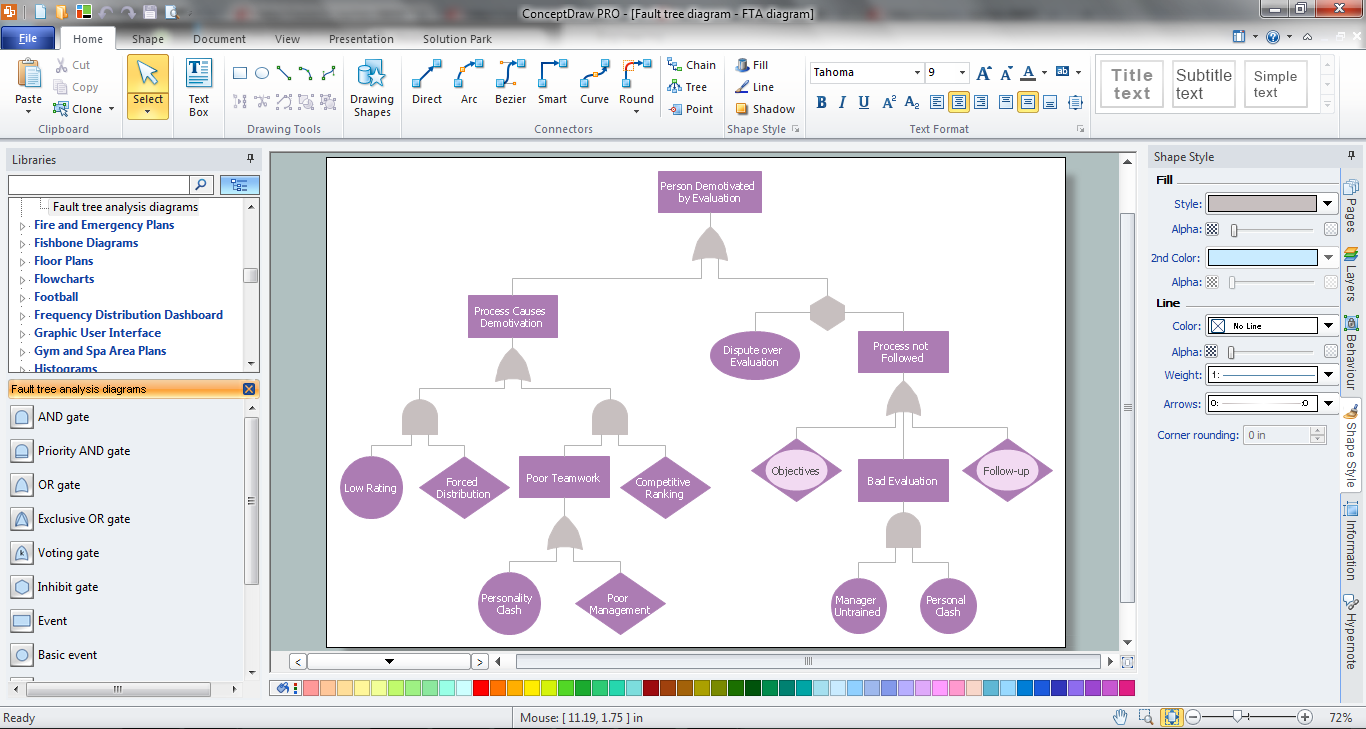
"Failure analysis is the process of collecting and analyzing data to determine the cause of a failure. It is an important discipline in many branches of manufacturing industry, such as the electronics industry, where it is a vital tool used in the development of new products and for the improvement of existing products. There are many companies which provide services to find the cause of failure in products, devices and in post disaster situations. The failure analysis process relies on collecting failed components for subsequent examination of the cause or causes of failure using a wide array of methods, especially microscopy and spectroscopy. The NDT or nondestructive testing methods (such as Industrial computed tomography scanning) are valuable because the failed products are unaffected by analysis, so inspection always starts using these methods." [Failure analysis. Wikipedia]
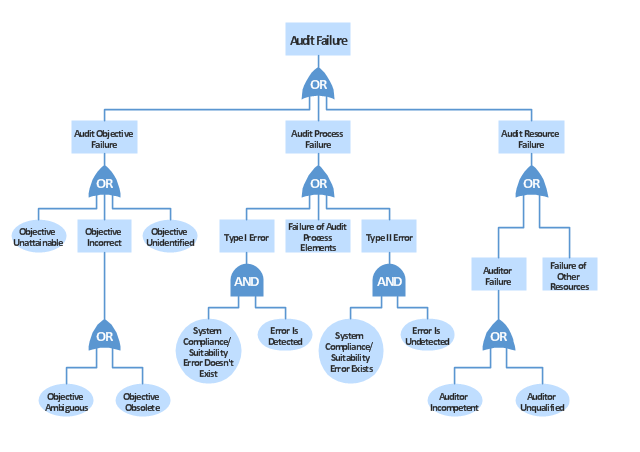
The example "Audit failure - Fault tree analysis diagram" was created using the ConceptDraw PRO diagramming and vector drawing software extended with the Fault Tree Analysis Diagrams solution from the Engineering area of ConceptDraw Solution Park.
The example "Audit failure - Fault tree analysis diagram" was created using the ConceptDraw PRO diagramming and vector drawing software extended with the Fault Tree Analysis Diagrams solution from the Engineering area of ConceptDraw Solution Park.
FTA diagram
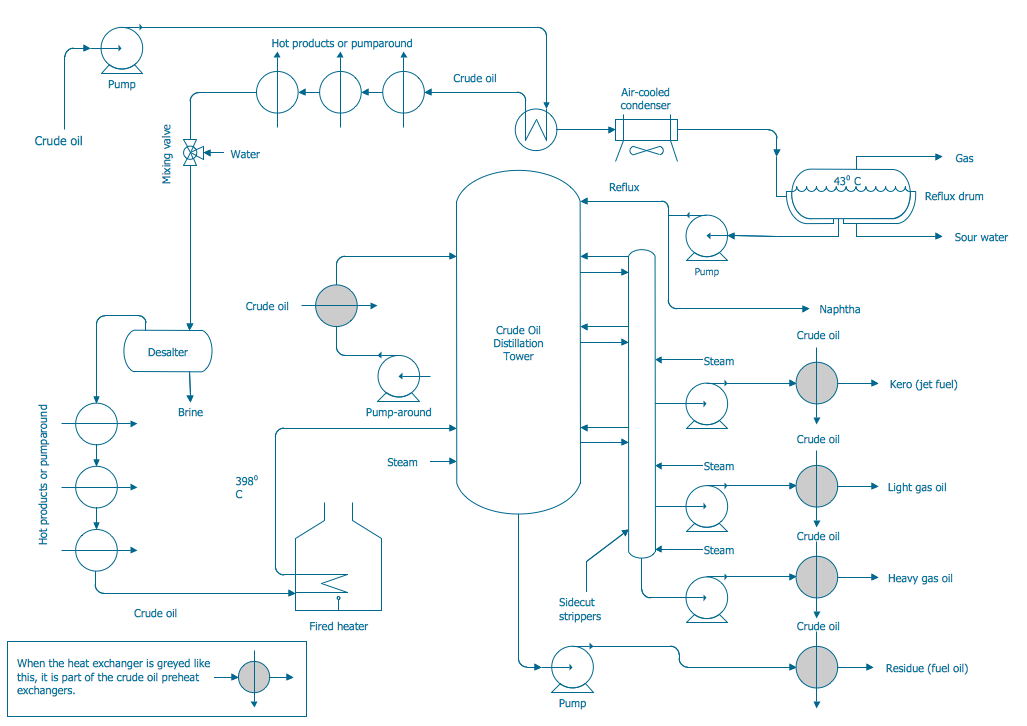
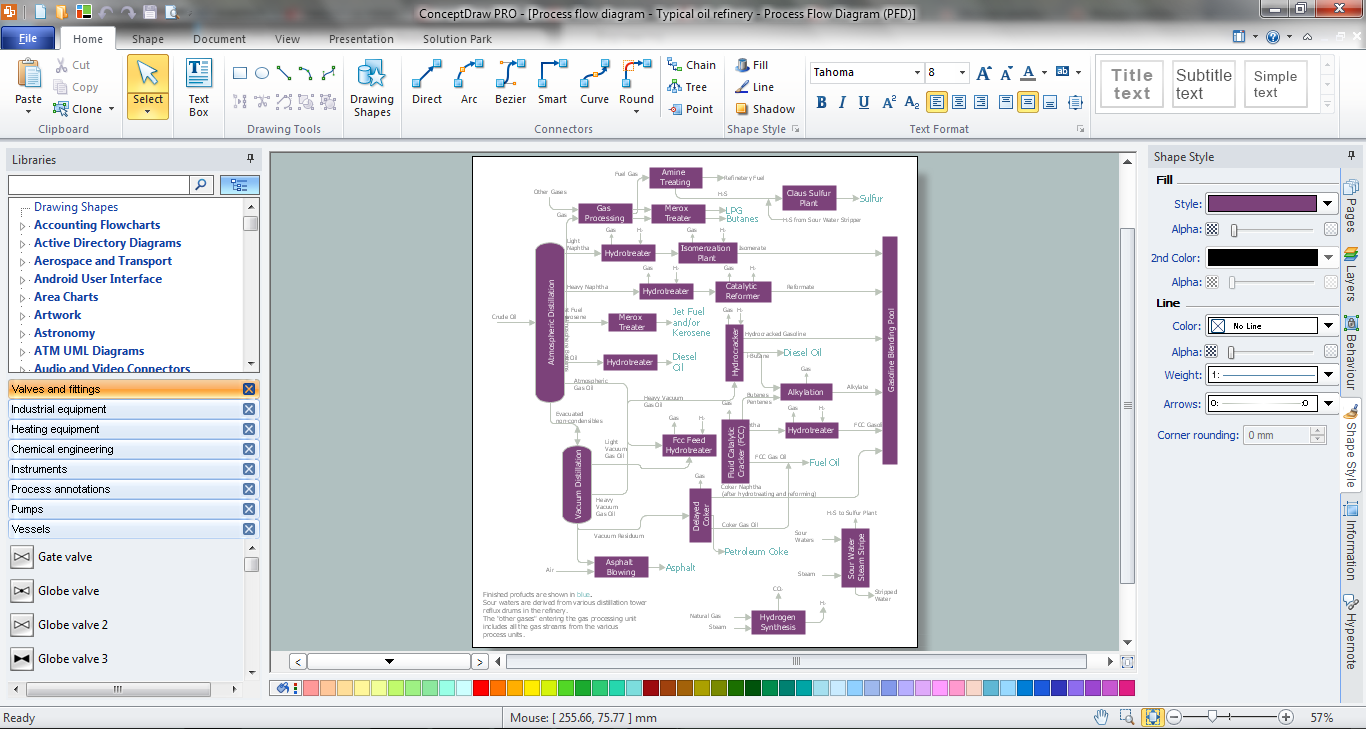
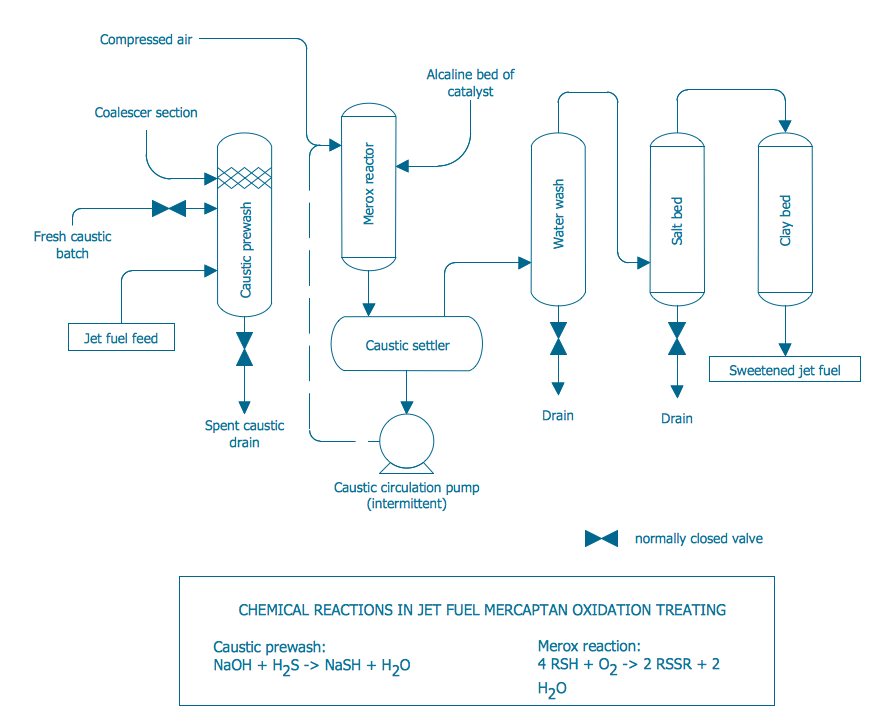
Process Flowchart


Process and Instrumentation Diagram
 Fishbone Diagram
Fishbone Diagrams solution extends ConceptDraw DIAGRAM software with templates, samples and library of vector stencils for drawing the Ishikawa diagrams for cause and effect analysis.
 ATM UML Diagrams
The ATM UML Diagrams solution lets you create ATM solutions and UML examples. Use ConceptDraw DIAGRAM as a UML diagram creator to visualize a banking system.
Process Engineering
 Plant Layout Plans
Plant Layout Plans solution can be used for power plant design and plant layout design, for making the needed building plant plans and plant layouts looking professionally good. Having the newest plant layout software, the plant design solutions and in particular the ConceptDraw’s Plant Layout Plans solution, including the pre-made templates, examples of the plant layout plans, and the stencil libraries with the design elements, the architects, electricians, interior designers, builders, telecommunications managers, plant design engineers, and other technicians can use them to create the professionally looking drawings within only a few minutes.
 Manufacturing and Maintenance
Manufacturing and maintenance solution extends ConceptDraw DIAGRAM software with illustration samples, templates and vector stencils libraries with clip art of packaging systems, industrial vehicles, tools, resources and energy.
Process Flow Diagram Symbols

Process Diagrams
 Marketing Diagrams
Marketing Diagrams solution extends ConceptDraw DIAGRAM diagramming software with abundance of samples, templates and vector design elements intended for easy graphical visualization and drawing different types of Marketing diagrams and graphs, including Branding Strategies Diagram, Five Forces Model Diagram, Decision Tree Diagram, Puzzle Diagram, Step Diagram, Process Chart, Strategy Map, Funnel Diagram, Value Chain Diagram, Ladder of Customer Loyalty Diagram, Leaky Bucket Diagram, Promotional Mix Diagram, Service-Goods Continuum Diagram, Six Markets Model Diagram, Sources of Customer Satisfaction Diagram, etc. Analyze effectively the marketing activity of your company and apply the optimal marketing methods with ConceptDraw DIAGRAM software.
Audio Visual Connectors Types

 Divided Bar Diagrams
The Divided Bar Diagrams Solution extends the capabilities of ConceptDraw DIAGRAM with templates, samples, and a library of vector stencils for drawing high impact and professional Divided Bar Diagrams and Graphs, Bar Diagram Math, and Stacked Graph.
- Fault Tree Analysis Diagrams | Root cause analysis tree diagram ...
- FTA diagram - Hazard analysis | Accident analytic tree - FTA ...
- Fault Tree Analysis In Pharmaceutical Industry
- Fault Tree Analysis Diagrams | Marketing Analysis Diagram ...
- Process Flowchart | Process Engineering | Fault Tree Analysis ...
- Fault Tree Analysis Software | Process Flowchart | Process and ...
- Process Flowchart | Process Engineering | Fault Tree Analysis ...
- Process Flowchart | Fault Tree Analysis Software | Sales Process ...
- Fault Tree Analysis Software | Analysis Accident Industry
- Process Flowchart | Gane Sarson Diagram | Fault Tree Analysis ...
- Process Flowchart | Process Engineering | Fault Tree Analysis ...
- Audit failure - Fault tree analysis diagram | Design elements - Fault ...
- Process Flowchart | Process Engineering | Fault Tree Analysis ...
- Fault Tree Analysis Software | Mind Mapmind Map Fishbone ...
- Process Flowchart | Process Engineering | Fault Tree Analysis ...
- Process Flowchart | SWOT Matrix | Fault Tree Analysis Software ...
- Analysis Industry
- Analysis Diagram Examples
- Process Flowchart | Fault Tree Analysis Software | Design elements ...
- Fault Tree Analysis Exa