 Sport Field Plans
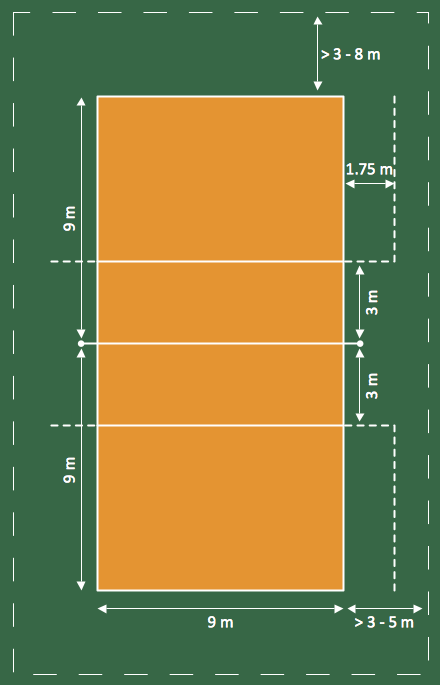
Construction of sport complex, playgrounds, sport school, sport grounds and fields assumes creation clear plans, layouts, or sketches. In many cases you need represent on the plan multitude of details, including dimensions, placement of bleachers, lighting, considering important sport aspects and other special things.
HelpDesk
How to Draw the Different Types of Pie Charts
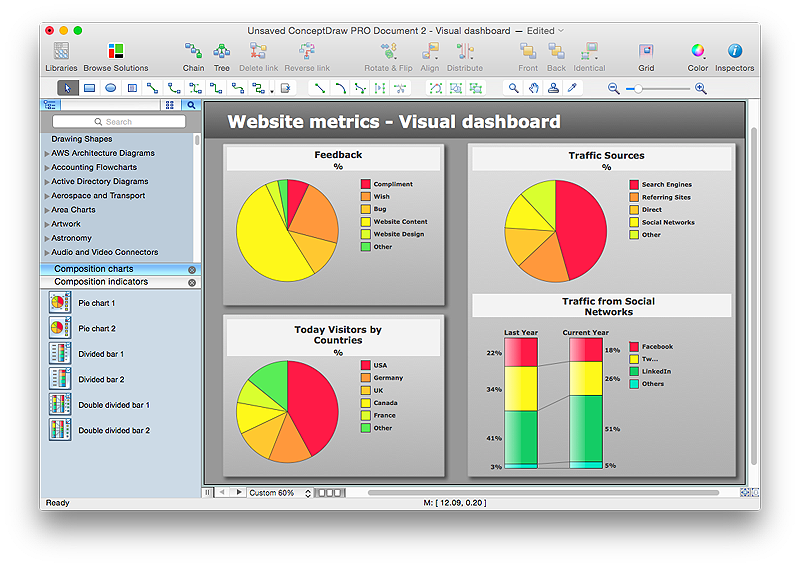
Using the Pie Chart, you can visually estimate the relative contribution that different data categories contribute to a whole value. The pie chart displays the statistics in a visual format. The main use of pie charts to show comparisons. The larger piece of the pie, the more the value of this value compared to the rest. Various applications of pie charts can be found in business and education. For business, pie charts can be used to compare the success or failure of the goods or services. They may also be used to display the business market share.HelpDesk
How to Create a Sport Field Plan Using ConceptDraw PRO
Sport fields and playgrounds fields are one of the most important resources for sport. They form the valuable area necessary to deliver possibilities for citizens to enjoy sports, games and other physical activities. Well planned fields for sport, playing and recreation help to maintain active and healthy society in urban and rural areas. ConceptDraw Sport Field Plans solution is time saving and handy professional tool. It provides the set of vector graphic objects that can be used for depicting of any of sport field or playground: football, basketball, volleyball, golf, etc. You can also add elements of the fields entourage: water pools, plants, parking and other objects.HelpDesk
How to Connect a Live Object to a Text Data Source
Instruction on how to connect a ConceptDraw live object with data source files in TXT format to visualize the actual values of your performance metrics.
- Sport Field Plans | Building Drawing Software for Design Sport ...
- Kidney Drawing Png
- Gym and Spa Area Plans | How to Draw a Floor Plan for SPA in ...
- Sport fields and recreation - Vector stencils library | Building ...
- Basketball Court Dimensions | Playground plan | Sport Field Plans ...
- Sport Field Plans | Building Drawing Software for Design Sport ...
- Drawing And Labelling Of Badminton Volleyball And Basketball
- Basketball courts - Vector stencils library | Design elements ...
- Basketball Court Drawing Board
- Basketball | Basketball Court Dimensions | How to Make a ...
- Plans And Drawings Of Kidney Shaped Pool
- Draw And Label A Volleyball Court
- Basketball Court Drawing Board Hd
- Badminton court | Interior Design Sport Fields - Design Elements ...
- Basketball Court For Drawing Plays
- Basketball Field in the Vector | Basketball Illustrations | Basketball ...
- Tennis Court Plan Drawing
- Basketball Ring Design
- Sport Field Plans | Badminton court | Building Drawing Software for ...
- Volleyball Basketball Tennis Court


