Accounting Flowchart Symbols

Graphical Symbols to use in EPC diagrams

BPR Diagram. Business Process Reengineering Example

The vector stencils library "Value stream mapping" contains 43 VSM symbols.
Use it for drawing value stream maps in the ConceptDraw PRO diagramming and vector drawing software extended with the Value Stream Mapping solution from the Quality area of ConceptDraw Solution Park.
www.conceptdraw.com/ solution-park/ business-value-stream-mapping
Use it for drawing value stream maps in the ConceptDraw PRO diagramming and vector drawing software extended with the Value Stream Mapping solution from the Quality area of ConceptDraw Solution Park.
www.conceptdraw.com/ solution-park/ business-value-stream-mapping
Inventory
Inventory

Information Flow

Shipment

Shipment

Material Flow
Material Pull

FIFO Line
Truck shipment/Logistics

Customer/Supplier

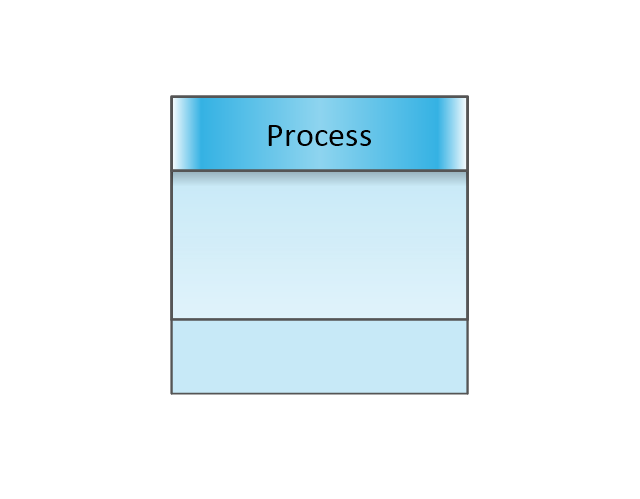
Dedicated Process

Shared Process
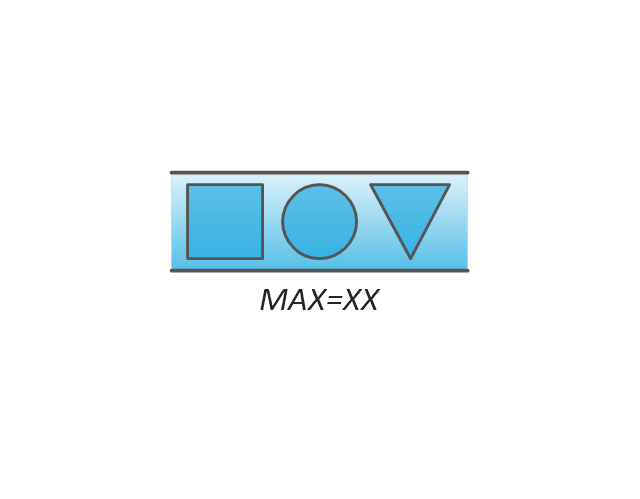
Supermarket Parts

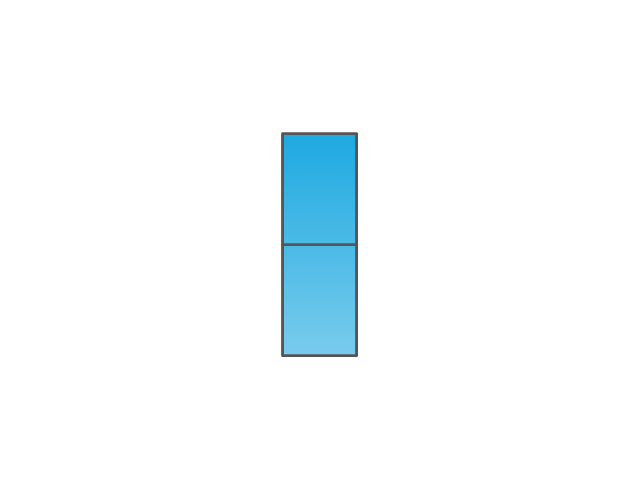
Data Box
Workcell

Kaizen Burst

Operator

Other
Production Control
Manual Info
Electronic Information Flow

Production Kanban

Withdrawal Kanban

Signal Kanban
Kanban Post

Sequenced Pull

Load Levelling

MRP/ERP
Go-See

Pull Arrow
Manual Info

Pull Arrow
Timeline Total
Ship
Forklift Truck

Plane

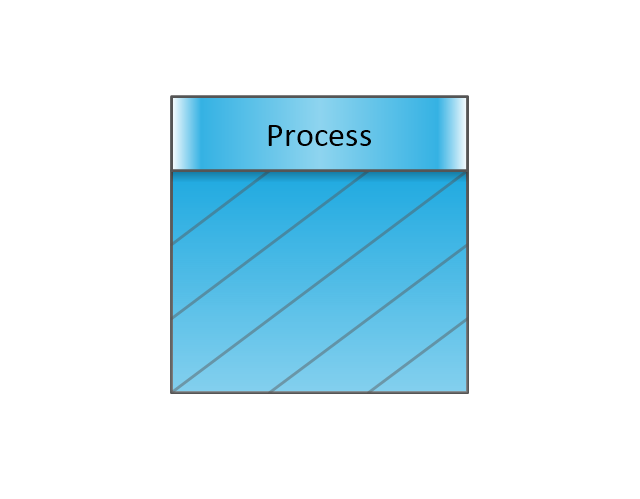
Process with Data
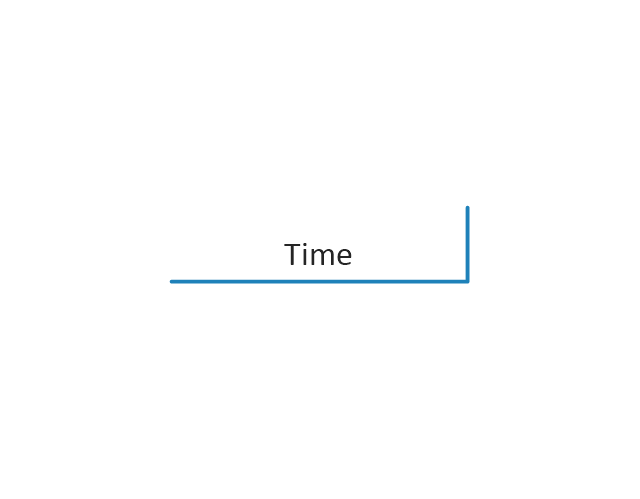
Timeline
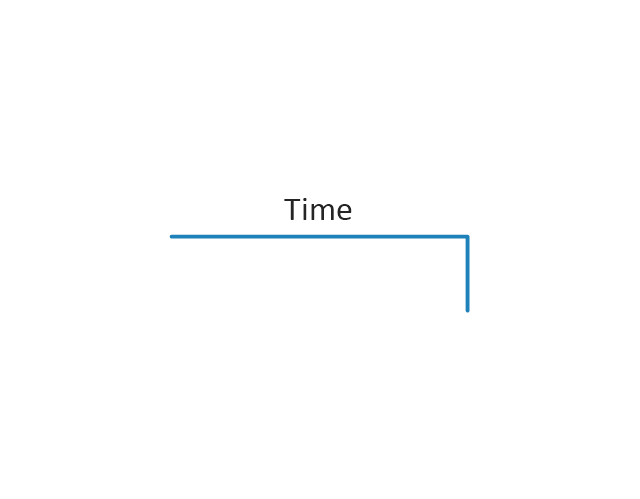
Timeline
Supermarket, 2

Supermarket, 3

Safety stock, 2
Safety stock, 3
 Entity-Relationship Diagram (ERD)
An Entity-Relationship Diagram (ERD) is a visual presentation of entities and relationships. That type of diagrams is often used in the semi-structured or unstructured data in databases and information systems. At first glance ERD is similar to a flowch
"Chen's notation for entity–relationship modeling uses rectangles to represent entity sets, and diamonds to represent relationships appropriate for first-class objects: they can have attributes and relationships of their own. If an entity set participates in a relationship set, they are connected with a line.
Attributes are drawn as ovals and are connected with a line to exactly one entity or relationship set.
Cardinality constraints are expressed as follows:
- a double line indicates a participation constraint, totality or surjectivity: all entities in the entity set must participate in at least one relationship in the relationship set;
- an arrow from entity set to relationship set indicates a key constraint, i.e. injectivity: each entity of the entity set can participate in at most one relationship in the relationship set;
- a thick line indicates both, i.e. bijectivity: each entity in the entity set is involved in exactly one relationship.
- an underlined name of an attribute indicates that it is a key: two different entities or relationships with this attribute always have different values for this attribute.
Attributes are often omitted as they can clutter up a diagram; other diagram techniques often list entity attributes within the rectangles drawn for entity sets." [Entity–relationship model. Wikipedia]
The vector stencils library ERD, Chen's notation contains 13 symbols for drawing entity-relatinship diagrams using the ConceptDraw PRO diagramming and vector drawing software.
The example "Design elements - ER diagram (Chen notation)" is included in the Entity-Relationship Diagram (ERD) solution from the Software Development area of ConceptDraw Solution Park.
Chen's ERD
.png--diagram-flowchart-example.png)
- | Fishbone Diagram | Contoh Flowchart Erp
- Process Flowchart | Data Flow Diagram Process | Material ...
- Basic Flowchart Symbols and Meaning | Workflow Diagram ...
- Basic Flowchart Symbols and Meaning | Flow chart Example ...
- Logistics Flow Charts | Sales Process Flowchart Symbols | Sales ...
- Erp System Architecture Diagram
- Audit System Example Erp Diagram
- Human Resource Management | HR management process ...
- Basic Flowchart Symbols and Meaning | Map symbols - Vector ...
- Entity Relationship Diagram Symbols | ERD Symbols and Meanings ...
- Process Flowchart | Basic Flowchart Symbols and Meaning ...
- Data Flow Diagram Process | Accounts Payable Process Flow Chart ...
- Contoh Flowchart | Business Process Flow Diagram | Basic ...
- Fire safety equipment - Vector stencils library | Accounting Flowchart ...
- Entity Relationship Diagram Examples | ERD Symbols and ...
- Electrical Symbols , Electrical Diagram Symbols | Process Flow ...
- Active Directory Diagrams | Security and Access Plans | Design ...
- Local area network (LAN). Computer and Network Examples | Basic ...
- Event-driven process chain (EPC) diagram | Cross Functional ...