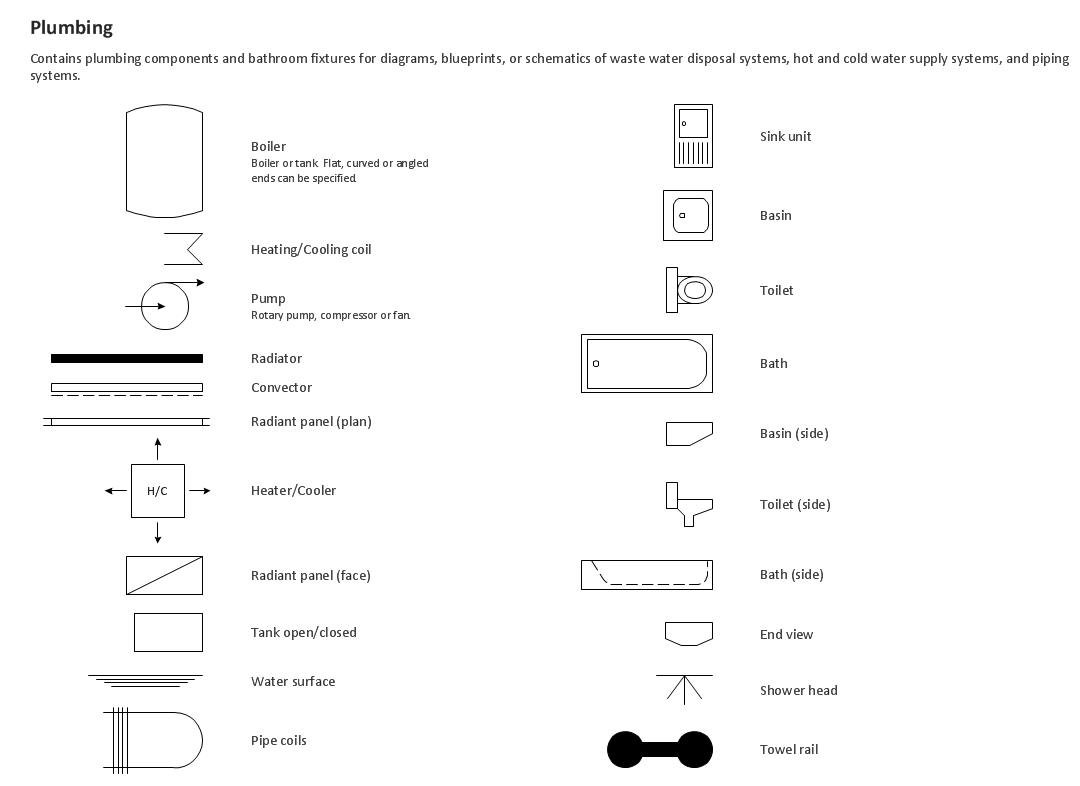
Building Drawing. Design Element — Plumbing
Any repair or replanning usually requires a work with engineering communications and sanitary equipment. This can be the new system's construction or the dismantling of old pipes and plumbing, and then installation the new ones. The reliability of plumbing system depends on many factors, but in any case, a prerequisite is careful planning, competent and qualified project's development, design of necessary Plumbing diagrams, creation the plan of plumbing works, high-quality laying of pipes and correct installation of engineering communications, plumbing and sanitary equipment according to the developed schemes. The key point at the development schemes and plans is the necessity to clearly think over all required plumbing equipment, to choose the types of pipes, a way of montage and to count their quantity. ConceptDraw DIAGRAM software extended with Plumbing and Piping Plans solution is the ease way to create professional-looking Plumbing plans, Piping plans, Water supply system plans, Plumbing system layout plans, thanks to the included plumbing and piping vector design elements.Value stream with ConceptDraw DIAGRAM
The Value stream is a totality of all actions on the projection, order composition and production: starting from creation a product project to launching this product, from order to delivery, from extraction of raw materials to ready product manufacturing. Value stream mapping is a process of visualization of these actions and creation of a detailed and graphical map.Gant Chart in Project Management
Gantt Chart is a graphical representation of tasks as segments on a time scale. It helps plan and monitor project development or resource allocation. There are list of tasks, project milesones and stages. The horizontal axis is a time scale, expressed either in absolute or relative time. Gantt chart can be used for planning in virtually any industry. There are major project planning tools using gantt chart for creating project plan. For instance, using ConceptDraw PROJECT together with ConceptDraw MINDMAP for planning marketing actions is very effective way. It makes ConceptDraw Office best marketing project management software for gantt chart planning marketing message, scheduling stages when to send massive text messages or when use email marketing services in specific projects. There are simple steps on how to use project management software for marketing, sales actions and product support. This is simple all in one toolbox for managers who need best project management software for small business as for planning and brainstorming as for reporting at project execution stage. Using gantt charts together with mindmap visuals and professional presentations charts make it excellent creative project management software. ConceptDraw PROJECT is portfolio project management software it allows manage many projects with multi gantt chart.
- Design elements - Qualifying | Signs Of Engineering Drawing
- Sign Conventions Used In Engg Drawing
- Mechanical Drawing Symbols | Design elements - Qualifying | How ...
- Mechanical Engineer In Different Letter And Symbols
- Mechanical Drawing Symbols | Process Flow Diagram Symbols ...
- Mechanical Drawing Symbols | Mechanical Engineering | Process ...


