 HR Dashboard
The HR Dashboard solution extends ConceptDraw DIAGRAM functionality with powerful drawing tools and great collection of comprehensive vector design elements, icons, pictograms and objects, navigation elements, live objects of HR charts, HR indicators, and thematic maps. The range of HR Dashboards applications is extensive, among them the human resource management, recruitment, hiring process, human resource development. ConceptDraw DIAGRAM software is perfect for creation HR Dashboard with any goal you need. It gives you all opportunities for designing not only informative, but also professional looking and attractive HR Dashboards of any style and degree of detalization, that are perfect for using in presentations, reports and other thematic documents.
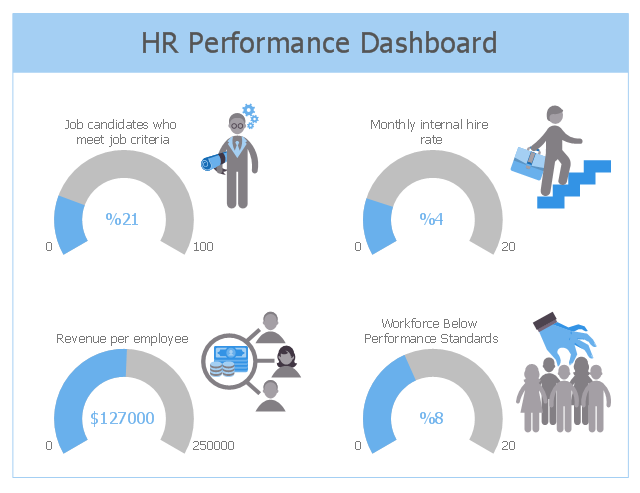
This HR dashboard sample depicts KPIs: job candidates who meet job criteria, monthly internal hire rate, revenue per employee, workforce below performance standards.
"Dashboards often provide at-a-glance views of KPIs (key performance indicators) relevant to a particular objective or business process (e.g. sales, marketing, human resources, or production).
... a human resources dashboard may show numbers related to staff recruitment, retention and composition, for example number of open positions, or average days or cost per recruitment." [Dashboard (business). Wikipedia]
The human resources dashboard example "HR Performance Dashboard" was designed using ConceptDraw PRO software extended with HR Dashboard solution from Management area of ConceptDraw Solution Park.
KPIs dashboard
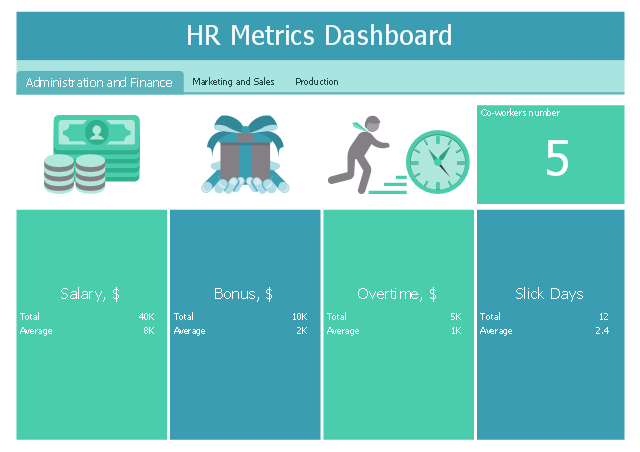
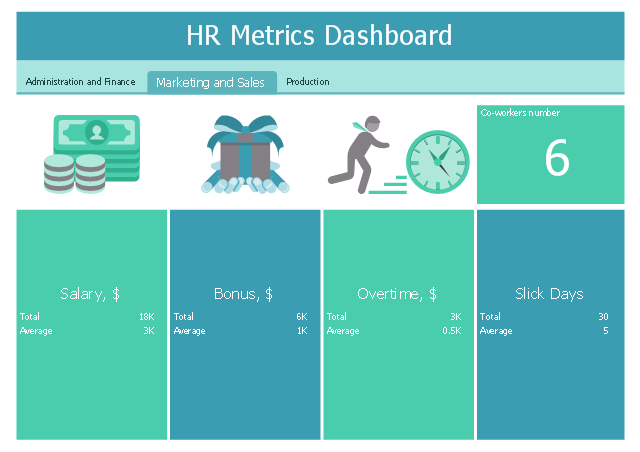
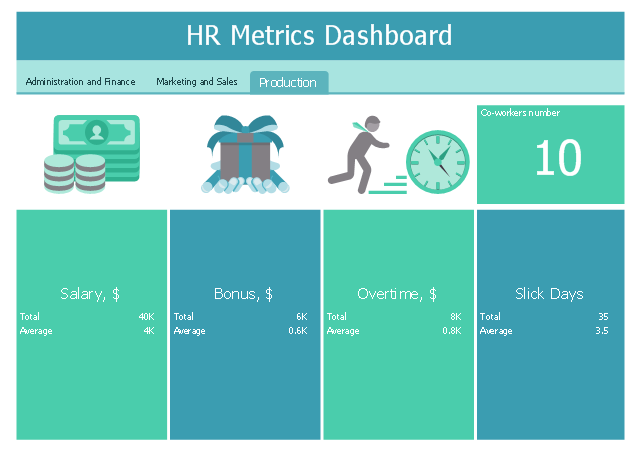
This performance dashboard sample shows HR metrics by departments: co-workrers number, salary, bonus, overtime, slick days.
"Human Resource (HR) metrics are measurements used to determine the value and effectiveness of HR initiatives, typically including such areas as turnover, training, return on human capital, costs of labor, and expenses per employee." [HR Metric. Wikipedia]
The human resources dashboard example "HR Metrics Dashboard" was designed using ConceptDraw PRO software extended with HR Dashboard solution from Management area of ConceptDraw Solution Park.
Administration and Finance
Marketing and Sales
Production
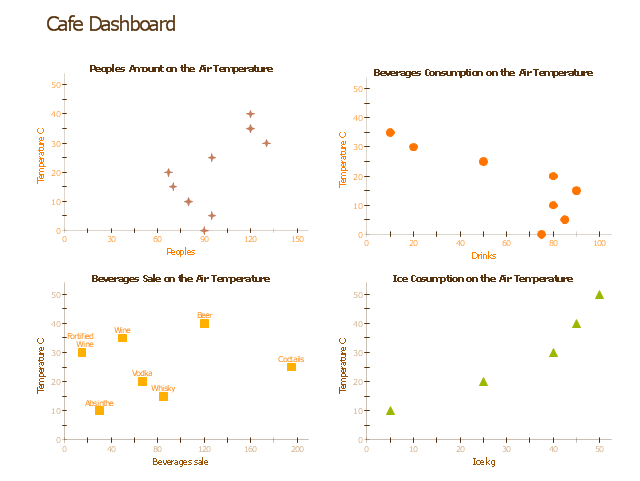
"A performance metric is that which determines an organization's behavior and performance. Performance metrics measure of an organization's activities and performance. It should support a range of stakeholder needs from customers, shareholders to employees. While traditionally many metrics are finance based, inwardly focusing on the performance of the organization, metrics may also focus on the performance against customer requirements and value. In project management, performance metrics are used to assess the health of the project and consist of the measuring of seven criteria: safety, time, cost, resources, scope, quality, and actions. Developing performance metrics usually follows a process of: 1. Establishing critical processes/ customer requirements. 2. Identifying specific, quantifiable outputs of work. 3. Establishing targets against which results can be scored." [Performance metric. Wikipedia] The example "Cafe performance metrics vs. air temperature - Visual dashboard" was created using the ConceptDraw PRO diagramming and vector drawing software extended with the Corellation Dashboard solution from the area "What is a Dashboard" of ConceptDraw Solution Park.
Visual dashboard
HelpDesk
How To Create an HR Metric Dashboard

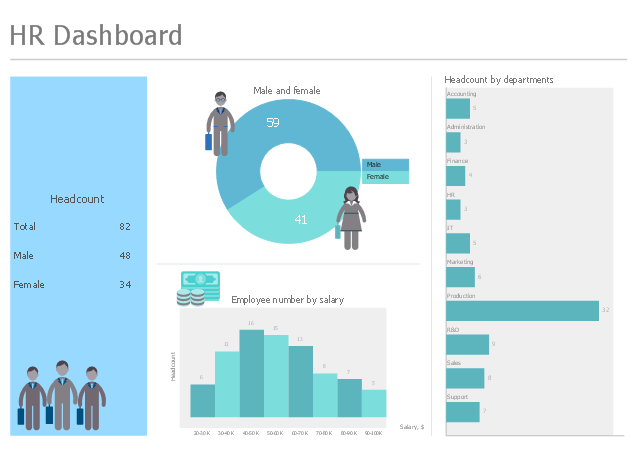
This HR dashboard sample shows business metrics and KPIs for human resources management: headcount, male and female ratio, employee distribution by salary, headcount by departments.
"Human Resource Management (HRM or HR) is the management of human resources. It is designed by the HR Department to maximize employee performance in service of an employer's strategic objectives. HR is primarily concerned with the management of people within organizations, focusing on policies and on systems. HR departments are responsible for overseeing employee-benefits design, employee recruitment, training and development, performance appraisal, and rewarding (e.g., managing pay and benefit systems)." [Human resource management. Wikipedia]
The human resources dashboard example "HR Dashboard" was designed using ConceptDraw PRO software extended with HR Dashboard solution from Management area of ConceptDraw Solution Park.
Human resources dashboard
 Meter Dashboard
Meter dashboard solution extends ConceptDraw DIAGRAM software with templates, samples and vector stencils library with meter indicators for drawing visual dashboards showing quantitative data.
This example was created on the base of the Georgia DOT Performance Management Dashboard from the Georgia Department of Transportation website.
[dot.ga.gov/ informationcenter/ statistics/ performance/ Pages/ default.aspx]
"Performance management (PM) includes activities which ensure that goals are consistently being met in an effective and efficient manner. Performance management can focus on the performance of an organization, a department, employee, or even the processes to build a product of service, as well as many other areas.
PM is also known as a process by which organizations align their resources, systems and employees to strategic objectives and priorities.
Performance management originated as a broad term coined by Dr. Aubrey Daniels in the late 1970s to describe a technology (i.e. science imbedded in applications methods) for managing both behavior and results, two critical elements of what is known as performance. A formal definition of performance management, according to Daniels' is "a scientifically based, data-oriented management system. It consists of three primary elements-measurement, feedback and positive reinforcement."" [Performance management. Wikipedia]
The meter dashboard example "Georgia DOT Performance Management" was created using the ConceptDraw PRO diagramming and vector drawing software extended with the Meter Dashboard solution from the area "What is a Dashboard" of ConceptDraw Solution Park.
Meter dashboard

- Employee distribution - HR dashboard | Frequency Distribution ...
- Logistic Dashboard | Logistics KPI Dashboard - Template | Logistics ...
- Georgia DOT performance management - Meter dashboard ...
- Financial Performance Dashboard
- Logistics Performance Dashboard - Template | Sales KPIs ...
- Cafe performance metrics vs. air temperature - Visual dashboard ...
- HR Metrics Dashboard | HR Dashboard | Enterprise dashboard | Hr ...
- Sales metrics and KPIs - Visual dashboard | Sales dashboard ...
- Employee distribution - HR dashboard | HR Dashboard | Frequency ...
- Projects HR dashboard | Employee distribution - HR dashboard ...