Biology Drawing

Biology Drawing Software

HelpDesk
How to a Draw Biology Diagram

Chemical Engineering

 Biology
Biology solution extends ConceptDraw DIAGRAM software with samples, templates and libraries containing biological vector symbols, to help you create scientific and educational designs in the field of biology.
Biology Illustration
How to Make SWOT Analysis in a Word Document

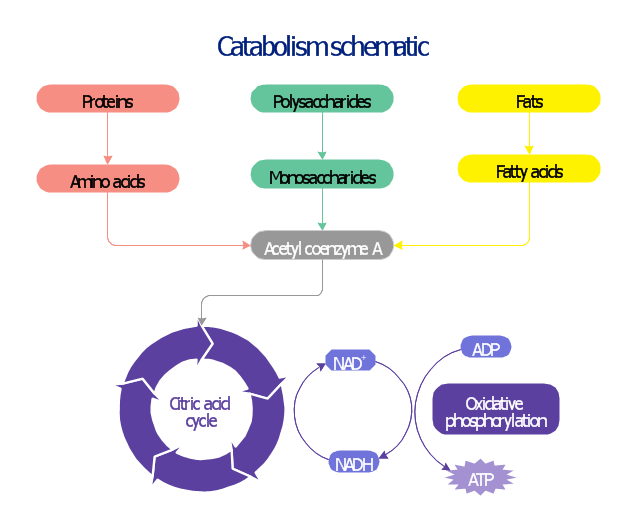
This biochemical chart display how proteins, polysaccharides and fats from food are digested into gastrointestinal tract into aminoacids, monosaccharides and fatty acids, and then broken down and oxidized to carbon dioxide and water in cellular processes of energy generation.
This metabolic pathway map was redesigned from Wikipedia file: Catabolism schematic.svg. [en.wikipedia.org/ wiki/ File:Catabolism_ schematic.svg]
The biochemical diagram example "Catabolism schematic" was created using the ConceptDraw PRO diagramming and vector drawing software extended with the Biology solution from the Science and Education area of ConceptDraw Solution Park.
Catabolic pathway map
 Venn Diagrams
Venn Diagrams are actively used to illustrate simple set relationships in set theory and probability theory, logic and statistics, mathematics and computer science, linguistics, sociology, and marketing. Venn Diagrams are also often used to visually summarize the status and future viability of a project.
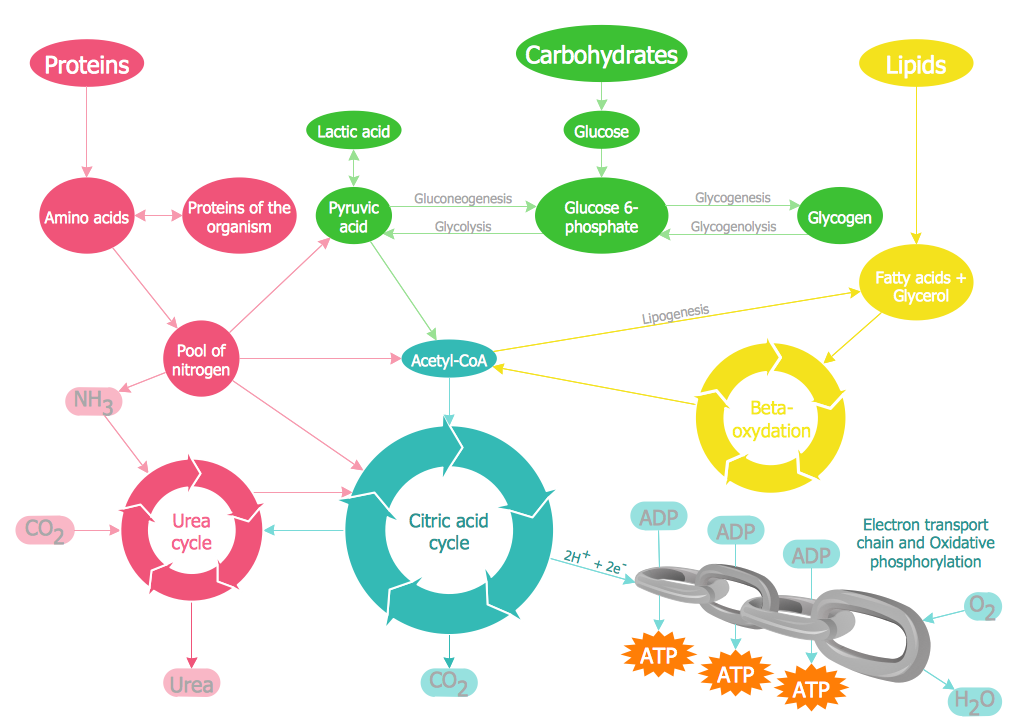
"In biochemistry, metabolic pathways are series of chemical reactions occurring within a cell. In each pathway, a principal chemical is modified by a series of chemical reactions. Enzymes catalyze these reactions, and often require dietary minerals, vitamins, and other cofactors in order to function properly. Because of the many chemicals (a.k.a. "metabolites") that may be involved, metabolic pathways can be quite elaborate. In addition, numerous distinct pathways co-exist within a cell. This collection of pathways is called the metabolic network. Pathways are important to the maintenance of homeostasis within an organism. Catabolic (break-down) and Anabolic (synthesis) pathways often work interdependently to create new biomolecules as the final end-products." [Metabolic pathway. Wikipedia]
The biochemical diagram example "Metabolic pathway map" was created using the ConceptDraw PRO diagramming and vector drawing software extended with the Biology solution from the Science and Education area of ConceptDraw Solution Park.
The biochemical diagram example "Metabolic pathway map" was created using the ConceptDraw PRO diagramming and vector drawing software extended with the Biology solution from the Science and Education area of ConceptDraw Solution Park.
Catabolic pathways

- Biology | Simple Sketch Of Polysaccharide
- Biology | Polysaccharide Sketch
- Design elements - Biochemistry of metabolism | Polysaccharides ...
- Glycolysis overview | Biology | Biology Drawing | Draw A Diagram ...
- Design elements - TCA cycle | Biology | Biology Drawing | Draw The ...
- Draw A Complete Overview Of Catabolic Pathways In Organisms
- Catabolism schematic - Biochemical diagram | Biology Drawing ...
- Citric acid cycle (TCA cycle) | Biology | Biology Drawing Software ...
- Draw And Label The Diagram Of Glycolysis