HelpDesk
How to Create a Data Flow Diagram using ConceptDraw PRO
Data flow diagramming is a highly effective technique for showing the flow of information through a system. Data flow diagrams reveal relationships among and between the various components in a program or system. DFD is an important technique for modeling a system’s high-level detail by showing how input data is transformed to output results through a sequence of functional transformations. The set of standard symbols is used to depict how these components interact in a system. ConceptDraw PRO allows you to draw a simple and clear Data Flow Diagram using special libraries.Army Flow Charts
Army flow charts provide an easy visual layout with a systematic approach for dealing with army issues.HelpDesk
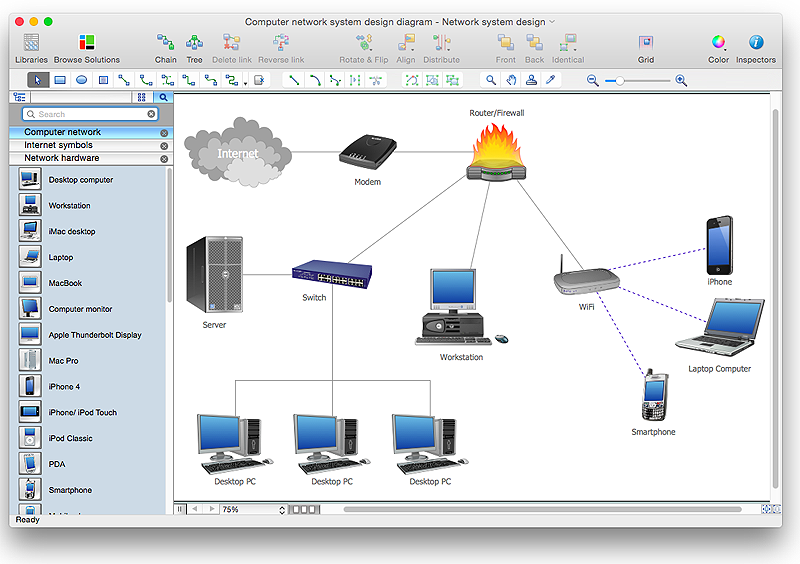
How to Create a Computer Network Diagram in ConceptDraw PRO
Computer Network diagram is intended to depict how a computer network is built and connected. It shows how data transfers between connections, and presents an overview of hardware and devices used. With the Conceptdraw solution for Computer Network Diagrams, system administrators, network architects and other related IT specialists have a perfect drawing tool that supplies adjective vector stencils representing hardware, telecom devices, and logical symbols that enhance possibilities in network diagramming, however complex the real network may be.HelpDesk
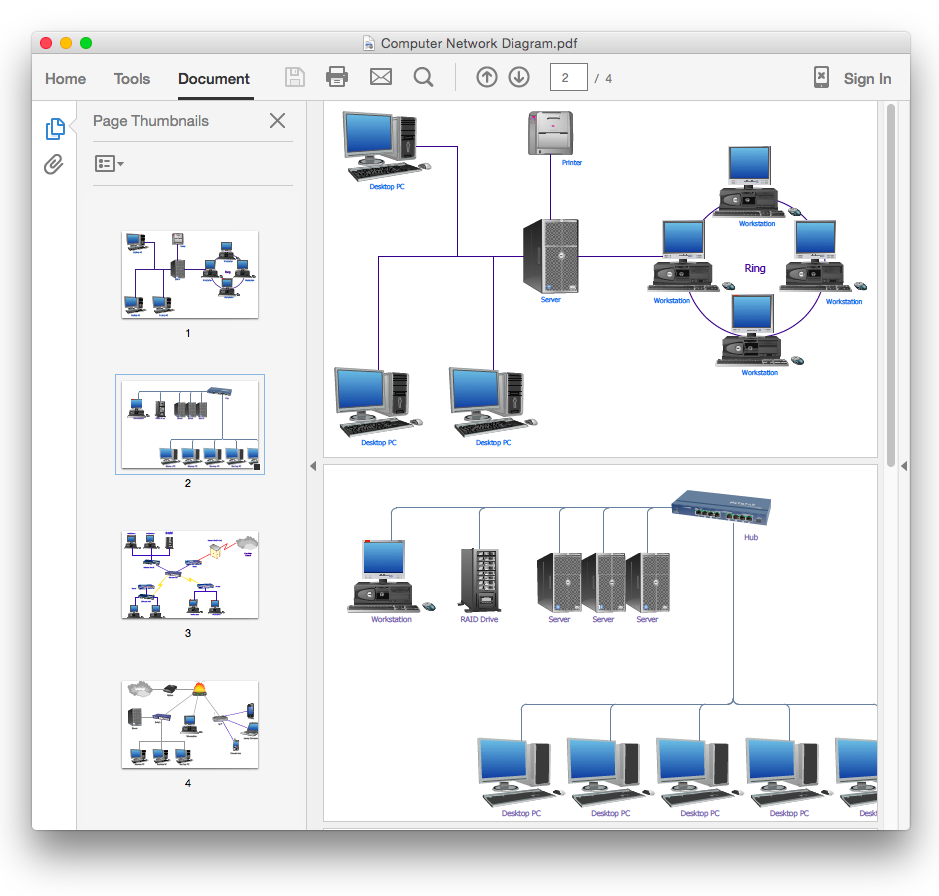
How To Convert a Computer Network Diagram to Adobe PDF Using ConceptDraw PRO
ConceptDraw PRO allows you to easy transmit your network documentation between different computers with different operating systems and applications using it's export capabilities.You can get clear network documentation pack in pdf format and avoid any problems while communicating it with stakeholders.HelpDesk
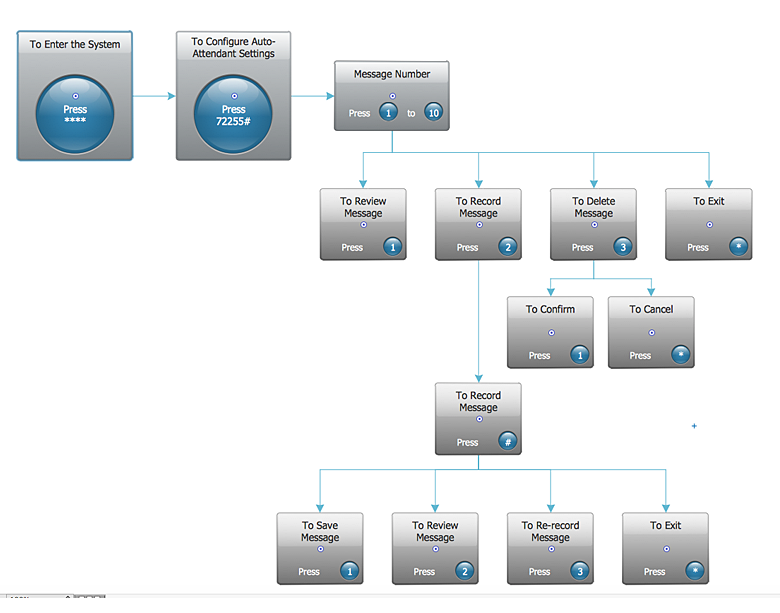
How to Create an Interactive Voice Response (IVR) Diagram in ConceptDraw PRO
Interactive Voice Response (IVR) Diagram is used to create and conduct the Interactive Voice Response systems for call-centers and voice mail services. IVR diagrams intended to visualize the logical and physical structure of Interactive voice response systems. ConceptDraw solution for Interactive Voice Response (IVR) Diagram allows you to create and communicate the Interactive Voice Response diagram of any complexity. Interactive Voice Response (IVR) System is a telecommunication technology that enables a computer to automatically process voice and touch phone signals. IVR systems allows users to interact through a computer with various service systems, available by telephone. The objective of IVR system is to reduce customer service costs by delivering self service to customers and guiding them to the information that they look for.HelpDesk
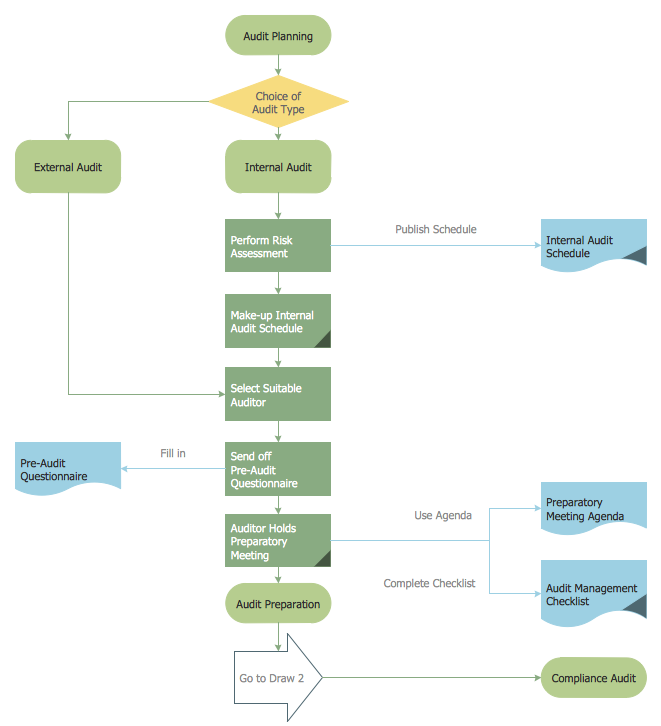
How to Create an Audit Flowchart Using ConceptDraw PRO
Audit flowcharts are often used in auditors activity. This is the most effective way of preparation and documentation of the audit process. Financial audit process has a clear structure, and therefore audit flowchart is often used to denote an audit process. This is the most effective way of preparation and documentation of the audit process. Flowcharts are often used in auditors activity. A flowchart may be created at any stage of an audit process as an aid in the determination and evaluation of a client's accounting system. ConceptDraw PRO allows you to create professional accounting flowchart quickly using the professional Audit Flowcharts solution.- How to Draw a Computer Network Diagrams | Process Flowchart ...
- Basic Flowchart Symbols and Meaning | How to Draw a Computer ...
- How to Draw a Computer Network Diagrams | Telecommunication ...
- Computer network system design diagram | How to Draw a ...
- How to Draw a Computer Network Diagrams | Process Flowchart ...
- How to Draw a Computer Network Diagrams | Process Flowchart ...
- Computer network system design diagram | Process Flowchart ...
- Accounting Flowcharts | How to Create Flowcharts for an Accounting ...
- How to Draw a Computer Network Diagrams | Computer Network ...
- Computer network system design diagram
- Flow Chart The Simple Computer Network Systems
- Block Diagram Of Computer System Using Graphics Program
- How to Draw a Computer Network Diagrams | Process Flowchart ...
- How to Create Flowcharts for an Accounting Information System ...
- Process Flowchart | Computer network system design diagram ...
- How to Draw a Computer Network Diagrams | Process Flowchart ...
- Computer Manufacturing Process Flow Chart
- Computer System Flowchart
- Draw A Structural Diagram Of Computer System
- Process Flowchart | Basic Flowchart Symbols and Meaning | How to ...

.jpg)


