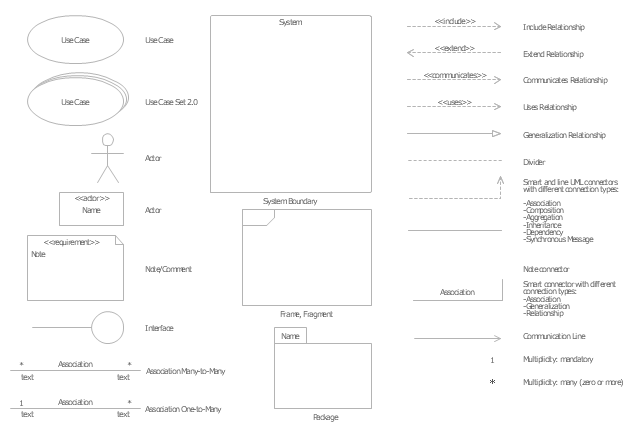
The vector stencils library "UML use case diagrams" contains 25 symbols for the ConceptDraw PRO diagramming and vector drawing software.
"Use case diagrams are usually referred to as behavior diagrams used to describe a set of actions (use cases) that some system or systems (subject) should or can perform in collaboration with one or more external users of the system (actors). Each use case should provide some observable and valuable result to the actors or other stakeholders of the system. ...
Use case diagrams are in fact twofold - they are both behavior diagrams, because they describe behavior of the system, and they are also structure diagrams - as a special case of class diagrams where classifiers are restricted to be either actors or use cases related to each other with associations. ...
Use case is usually shown as an ellipse containing the name of the use case. ...
Name of the use case could also be placed below the ellipse. ...
If a subject (or system boundary) is displayed, the use case ellipse is visually located inside the system boundary rectangle. Note, that this does not necessarily mean that the subject classifier owns the contained use cases, but merely that the use case applies to that classifier. ...
A list of use case properties - operations and attributes - could be shown in a compartment within the use case oval below the use case name. ...
Use case with extension points may be listed in a compartment of the use case with the heading extension points. ...
A use case can also be shown using the standard rectangle notation for classifiers with an ellipse icon in the upper right-hand corner of the rectangle and with optional separate list compartments for its features. ...
Subject (sometimes called a system boundary) is presented by a rectangle with subject's name, associated keywords and stereotypes in the upper left corner. Use cases applicable to the subject are located inside the rectangle and actors - outside of the system boundary. ...
Standard UML notation for actor is "stick man" icon with the name of the actor above or below of the icon. Actor names should follow the capitalization and punctuation guidelines for classes. The names of abstract actors should be shown in italics. ...
Custom icons that convey the kind of actor may also be used to denote an actor, such as using a separate icon(s) for non-human actors. ...
An actor may also be shown as a class rectangle with the standard keyword «actor», having usual notation for class compartments ...
An actor can only have binary associations to use cases, components, and classes. ...
An association between an actor and a use case indicates that the actor and the use case somehow interact or communicate with each other.
Only binary associations are allowed between actors and use cases.
An actor could be associated to one or several use cases. ...
A use case may have one or several associated actors." [uml-diagrams.org/ use-case-diagrams.html]
The example "Design elements - UML use case diagrams" is included in the Rapid UML solution from the Software Development area of ConceptDraw Solution Park.
UML use case diagram symbols
 AWS Architecture Diagrams
AWS Architecture Diagrams with powerful drawing tools and numerous predesigned Amazon icons and AWS simple icons is the best for creation the AWS Architecture Diagrams, describing the use of Amazon Web Services or Amazon Cloud Services, their application for development and implementation the systems running on the AWS infrastructure. The multifarious samples give you the good understanding of AWS platform, its structure, services, resources and features, wide opportunities, advantages and benefits from their use; solution’s templates are essential and helpful when designing, description and implementing the AWS infrastructure-based systems. Use them in technical documentation, advertising and marketing materials, in specifications, presentation slides, whitepapers, datasheets, posters, etc.
Bubble diagrams in Landscape Design with ConceptDraw DIAGRAM

The FTA diagram sample "Fault tree analysis - Insulin delivery system" was redesigned from the illustration of "CMSI 641: Introduction to Software Engineering. Design of Critical Systems. B.J. Johnson. 2005. Loyola Marymount University".
"Another way of assessing hazards is using fault tree analysis. In this process, each of the identified hazards is covered by a detailed analysis to find out what might cause it. Either inductive or deductive reasoning is applied. In the case of software hazards, the usual focus is to determine faults that will cause the system to fail to deliver a system service, such as a monitoring system. A "fault tree" is constructed to link all the possible situations together, to help identify the interrelationships of the failures, which modules may cause them, and what "trickle-down effects" there might be. Here is an example of a fault tree, as applied to the Insulin delivery system from Sommerville...
Note that this tree is only partially complete, since only the potential software faults are shown on the diagram. The potential failures involving hardware, such as low battery, blood monitor or sensor failure, patient over-exertion or inattention, or medical staff failure are noticeable by their absence.
The fault tree and safety specification processes are two ways of helping with system risk assessment tasks. Once the risks are identified, there are other assessments that need to take place. First, the likelihood of the risk occurrance must be assessed. This is often quantifiable, so numbers may be assigned based on things like MTBF, latency effects, and other known entities. There may be other non-quantifiable contributors to the risk likelihood, however, such that these must be assessed and estimated by experts in the domain. (Don't short-change this process when dealing with critical systems!) Finally, the risk assessment must include the severity of the risk, meaning an estimation of the cost to the project in the event the risk item actually does occur. "Cost to the project" means all associated costs, including schedule delays, human injury, damage to hardware, corruption of data, and so on."
[myweb.lmu.edu/ bjohnson/ cmsi641web/ week15-2.html]
The FTA diagram example "Fault tree analysis - Insulin delivery system" was created using the ConceptDraw PRO diagramming and vector drawing software extended with the Fault Tree Analysis Diagrams solution from the Engineering area of ConceptDraw Solution Park.
FTA diagram

IDEF9 Standard

- Which Of The Below Diagrams Does Not Show How A System Or
- Which Diagram Shows Only What The System Does
- Which Of The Below Diagram Does Not Shows How A System Or
- Which Of The Below Diagram Does Not Show How A System Or
- Below Diagrams Does Not Show How A System Or Business Area
- Which Of The Following Dialgrams Does Not Show How A System
- , _which Of The Below Diagrams Does Not Show How A System Or ...
- Basic Flowchart Symbols and Meaning | Mcq Which Of The Below ...
- Which Of The Following Diagram Does Not Show How A System Or
- Which Diagram Does Not Show How System Area Works And
- Which Of The Following Diagrams Does Not Show How A System Or
- Does Not Show How A System Or Business Area Works And Shows
- Which Of The Following Diagram Does Not Show How A System Or
- Which Of The Below Diagrams Does Not Show How A System Or
- Which Of The Below Diagrams Does Not Show How A System Or
- Which Of The Following Doesnt Show How A System Or Business
- Which One Of The Below Diagram Does Not Show How A System
- Which Of The Diagram Does Not Show How A System Or Business
- Which Of The Below Diagrams Show How A System Or A Business
- Which Diagram Shows What The System Does