The vector stencils library "Bank UML composite structure diagram" contains 10 shapes for drawing UML composite structure diagrams.
Use it for object-oriented modeling of your bank information system.
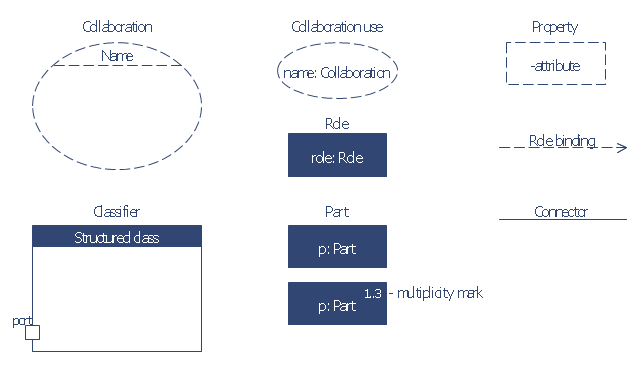
"The key composite structure entities identified in the UML 2.0 specification are structured classifiers, parts, ports, connectors, and collaborations.
* Part : A part represents a role played at runtime by one instance of a classifier or by a collection of instances. The part may only name the role, it may name an abstract superclass, or it may name a specific concrete class. The part can include a multiplicity factor, such as the [0..*] shown for Viewer in the diagram.
* Port : A port is an interaction point that can be used to connect structured classifiers with their parts and with the environment. Ports can optionally specify the services they provide and the services they require from other parts of the system. In the diagram, each of the small squares is a port. Each port has a type and is labelled with a name... in the diagram. Ports may contain a multiplicity factor...
* Connector : A connector binds two or more entities together, allowing them to interact at runtime. The connector is shown as a line between some combination of parts, ports and structured classifiers. The diagram shows three connectors between ports, and one connector between a structured classifier and a part.
* Collaboration : A collaboration is generally more abstract than a structured classifier. It is shown as a dotted oval containing roles that instances can play in the collaboration.
* Structured classifier: A StructuredClassifier represents a class, often an abstract class, whose behavior can be completely or partially described through interactions between parts.
An EncapsulatedClassifier is a type of structured classifier that contains ports." [Composite structure diagram. Wikipedia]
This example of UML composite structure diagram symbols for the ConceptDraw PRO diagramming and vector drawing software is included in the ATM UML Diagrams solution from the Software Development area of ConceptDraw Solution Park.
Use it for object-oriented modeling of your bank information system.
"The key composite structure entities identified in the UML 2.0 specification are structured classifiers, parts, ports, connectors, and collaborations.
* Part : A part represents a role played at runtime by one instance of a classifier or by a collection of instances. The part may only name the role, it may name an abstract superclass, or it may name a specific concrete class. The part can include a multiplicity factor, such as the [0..*] shown for Viewer in the diagram.
* Port : A port is an interaction point that can be used to connect structured classifiers with their parts and with the environment. Ports can optionally specify the services they provide and the services they require from other parts of the system. In the diagram, each of the small squares is a port. Each port has a type and is labelled with a name... in the diagram. Ports may contain a multiplicity factor...
* Connector : A connector binds two or more entities together, allowing them to interact at runtime. The connector is shown as a line between some combination of parts, ports and structured classifiers. The diagram shows three connectors between ports, and one connector between a structured classifier and a part.
* Collaboration : A collaboration is generally more abstract than a structured classifier. It is shown as a dotted oval containing roles that instances can play in the collaboration.
* Structured classifier: A StructuredClassifier represents a class, often an abstract class, whose behavior can be completely or partially described through interactions between parts.
An EncapsulatedClassifier is a type of structured classifier that contains ports." [Composite structure diagram. Wikipedia]
This example of UML composite structure diagram symbols for the ConceptDraw PRO diagramming and vector drawing software is included in the ATM UML Diagrams solution from the Software Development area of ConceptDraw Solution Park.
UML composite structure diagram symbols
 Pyramid Diagrams
Pyramid Diagrams solution extends ConceptDraw PRO software with templates, samples and library of vector stencils for drawing the marketing pyramid diagrams.
 GHS Hazard Pictograms
GHS Hazard Pictograms solution contains the set of predesigned standard GHS pictograms, Hazardous symbols, and Hazard communication pictograms, approved and agreed by UN in Globally Harmonized System of Classification and Labelling of Chemicals (GHS). They can be used for quick and simple designing accurate and professional-looking infographics, diagrams, warning announcements, signboards, posters, precautionary declarations, regulatory documents, and for representing the main items of OSHA HAZCOM Standard.
 Marketing Area
The solutions from Marketing area of ConceptDraw Solution Park collect templates, samples and libraries of vector stencils for drawing the marketing diagrams and mind maps.
 Concept Maps
The technique of concept mapping was developed as a constructive way of representing knowledge in science and increasing the meaningfulness of learning. Now, the creation of a concept map is extremely helpful when used in education as learning and teaching techniques that assist memorization. Concept maps are also used for idea generation in brainstorming sessions, and for detailing the structure of complex ideas.
 Entity-Relationship Diagram (ERD)
An Entity-Relationship Diagram (ERD) is a visual presentation of entities and relationships. That type of diagrams is often used in the semi-structured or unstructured data in databases and information systems. At first glance ERD is similar to a flowch
- Clearly Labelled Diagram That Illustrates All Indicators
- A Well Labelled Overhead Projector Diagram
- Use One Clearly Labeled Diagram To Illustrate All Indicators
- Basketball Court Diagram and Basketball Positions | Basic ...
- Basic Flowchart Symbols and Meaning | A Clearly Labelled Diagram ...
- Draw A Clearly Labelled Blocked Diagram Of A Database System
- 4 Level pyramid model diagram - Information systems types ...
- Basic CCTV System Diagram . CCTV Network Diagram Example ...
- Basic Flowchart Symbols and Meaning | Labelled Diagram ...
- Design elements - Bank UML composite structure diagram | Design ...
- How To Draw A Labelled Diagram To Illustrate All Indicators
- A Labelled Diagram Of Balance Support
- 5 Level pyramid model diagram - Information systems types | Data ...
- UML activity diagram - Payment process | ATM UML Diagrams ...
- Fully Connected Network Topology Diagram | Network Topologies ...
- ATM UML Diagrams | UML Component Diagram Example - Online ...
- Bank UML Diagram
- Tree Network Topology Diagram | Fully Connected Network ...
- ATM UML Diagrams | UML Component Diagram Example - Online ...
- ATM UML Diagrams | Data Flow Diagram Process | Pyramid ...