HelpDesk
How to Design a Fast-Food Restaurant Menu Using ConceptDraw PRO

 Food Court
Use the Food Court solution to create food art. Pictures of food can be designed using libraries of food images, fruit art and pictures of vegetables.
 Business Intelligence Dashboard
Business Intelligence Dashboard solution extends the ConceptDraw PRO v11 functionality with exclusive tools, numerous ready-to-use vector objects, samples and quick-start templates for creation professional Business Intelligence Dashboards, Business Intelligence Graphics, Business Intelligence Charts and Maps of different kinds. Design easy the BI dashboard, BI model or Dynamic chart in ConceptDraw PRO to monitor the company's work, to track the indicators corresponding your company's data, to display and analyze key performance indicators, to evaluate the trends and regularities of the processes occurring at the company.
 Logistic Dashboard
The powerful tools of Logistic Dashboard solution and specially developed live graphic objects of logistic icons, logistic navigation elements, logistic indicators, logistic charts and logistic maps effectively assist in designing Logistic dashboards, Logistic maps, Logistic charts, diagrams and infographics. The included set of prebuilt samples and quick-start templates, demonstrates the power of ConceptDraw PRO software in logistics management, its assisting abilities in development, realization and analyzing the logistic processes, as well as in perfection the methods of logistics management.
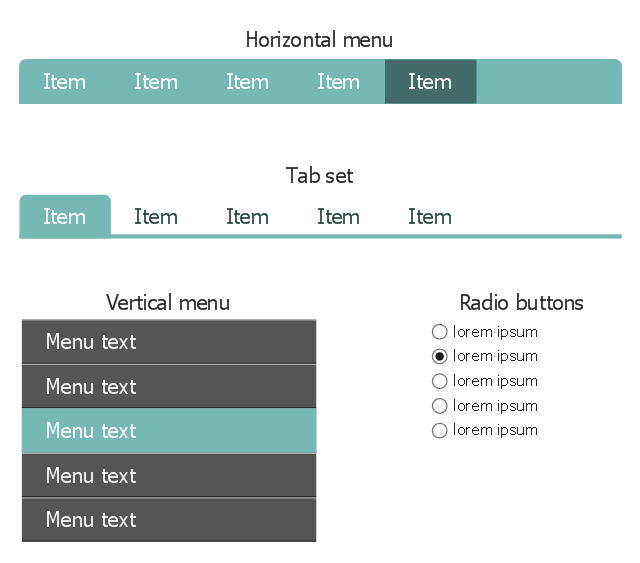
The vector stencils library "BI navigation" contains 4 graphical gontrols: horizontal and vertical menus, radio buttons and tab set.
Use it to design user interface of your business intelligence dashboards in ConceptDraw PRO software.
"A widget (also graphical control element or control) is an element of interaction in a graphical user interface (GUI), such as a button or a scroll bar. Controls are software components that a computer user interacts with through direct manipulation to read or edit information about an application." [Widget (GUI). Wikipedia]
The graphical controls example "Design elements - BI navigation" is included in the Business Intelligence Dashboards solution from the Business Processes area of ConceptDraw Solution Park.
Navigation elements
 Android User Interface
The Android User Interface solution allows ConceptDraw PRO act as an Android UI design tool. Libraries and templates contain a variety of Android GUI elements to help users create images based on Android UI design.
 Interactive Voice Response Diagrams
Interactive Voice Response Diagrams solution extends ConceptDraw PRO v10 software with samples, templates and libraries of ready-to-use vector stencils that help create Interactive Voice Response (IVR) diagrams illustrating in details a work of interactive voice response system, the IVR system’s logical and physical structure, Voice-over-Internet Protocol (VoIP) diagrams, and Action VoIP diagrams with representing voice actions on them, to visualize how the computers interact with callers through voice recognition and dual-tone multi-frequency signaling (DTMF) keypad inputs.
 Windows 10 User Interface
Windows 10 User Interface solution extends significantly ConceptDraw PRO v11 functionality with look-and-feel functions of GUI software and makes it a great assistant for Win10 designers, developers, and software engineers. This solution provides a wide s
HelpDesk
How to Create Infographics that Help People Eat Healthy

 macOS User Interface
macOS User Interface solution extends the ConceptDraw PRO functionality with powerful GUI software graphic design features and tools. It provides an extensive range of multifarious macOS Sierra user interface design examples, samples and templates, and wide variety of libraries, containing a lot of pre-designed vector objects of Mac Apps icons, buttons, dialogs, menu bars, indicators, pointers, controls, toolbars, menus, and other elements for fast and simple designing high standard user interfaces of any complexity for new macOS Sierra.
 PM Dashboards
This solution extends ConceptDraw PRO and ConceptDraw PROJECT software with the ability to clearly display the identified key performance indicators for any project.
HelpDesk
How to Design a Mockup of Windows 10 User Interface

HelpDesk
How to Design a Food-related Infographics Using ConceptDraw PRO

HelpDesk
How to Design a Mockup of Apple macOS Sierra GUI

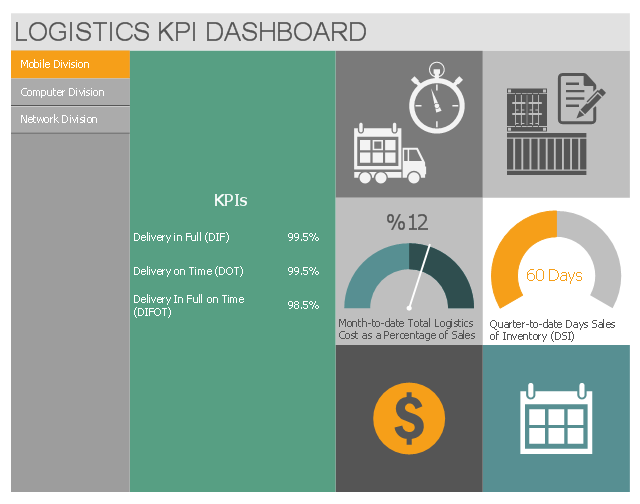
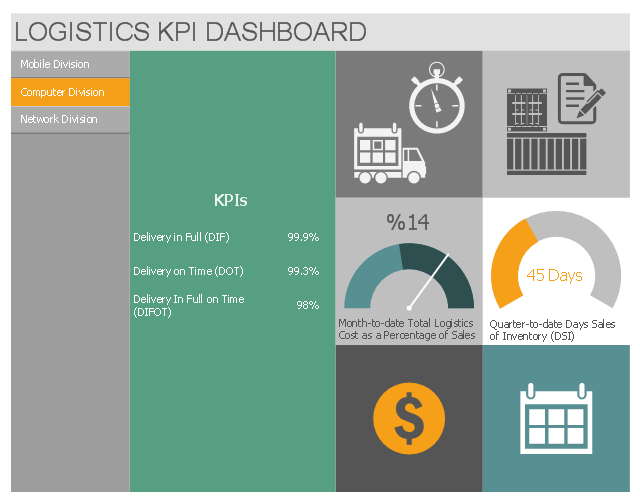
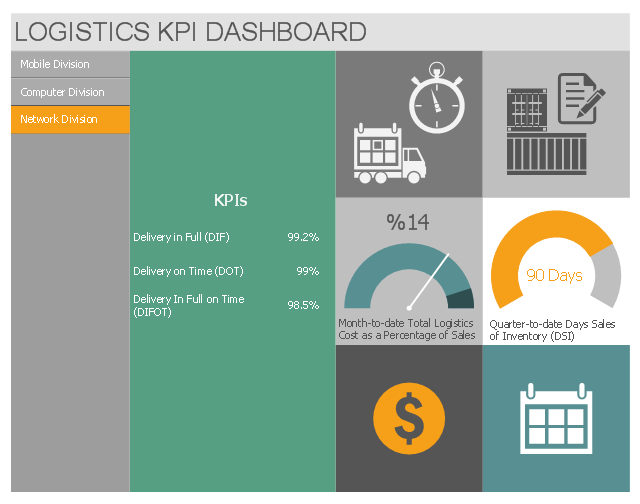
This multipage business dashboard example shows navigation vertical menu and graphic indicators of logistic key performance indicators (KPIs) and business metrics.
"A performance indicator or key performance indicator (KPI) is a type of performance measurement. KPIs evaluate the success of an organization or of a particular activity in which it engages. Often success is simply the repeated, periodic achievement of some levels of operational goal..., and sometimes success is defined in terms of making progress toward strategic goals. Accordingly, choosing the right KPIs relies upon a good understanding of what is important to the organization." [Performance indicator. Wikipedia]
The performance dashboard example "Logistics KPI Dashboard" was designed using ConceptDraw PRO software extended with Logistic Dashboard solution from Business Processes area of ConceptDraw Solution Park.
Mobile Division
Computer Division
Network Division
- Design elements - BI navigation | GUI Software | Horizontal Menu ...
- Android Dashboard Menu Example
- Website Wireframe | Interface Design | Flowchart Software | Sub ...
- Android Dashboard Design Example
- Sub Menu Icons
- Design elements - Status indicators | Status Dashboard | iPhone OS ...
- Design elements - Sales KPIs and metrics | Geo Map - Asia | BCG ...
- Design elements - IVR computer | Glyph icons - Vector stencils ...
- Graphic Design How To Design A Dashboard
- Design elements - Comparison charts and indicators | Design ...
- Design elements - Android switches and sliders | Android GUI ...
- Dashboard Design Pie
- Flowchart design . Flowchart symbols, shapes, stencils and icons ...
- Design elements - Meter indicators | Mac OS X user interface ...
- Correlation Dashboard | Correlation dashboard - Template | Design ...
- Basic Flowchart Symbols and Meaning | Mechanical Drawing ...
- Interior Design Storage and Distribution - Design Elements ...
- Dashboard Ui Design
- Dashboard Database Design
- Project task status dashboard - Template | Sales Dashboard ...