HelpDesk
What Information to be Displayed in the ConceptDraw PROJECT Gantt Chart View


"A concept map is a diagram showing the relationships among concepts, with the concepts drawn in rectangular boxes (or other shapes), which are connected with labelled lines (or arrows) that denote the relationships between concepts, such as "is a", "gives rise to", "results in", "is required by," or "contributes to". ...
The concept map can take the shape and composition of other map types. They can take the shape of the context diagram, tree diagram or venn diagram, but other shapes and compositions are also possible. ...
A concept map can be drawn with all kinds of elements:
(1) Text and lines.
(2) Blocks and arrows.
(3) Circles.
(4) Additional text.
(5) Additional listings.
(6) Additional icons.
(7) Additional Illustration (as groundplan).
(8) Additional legenda. ...
A concept map shows a number of elements, relations and/ or properties in one or more layers. ...
The relation between the elements can be pictures with specific shapes (lines, arrow)." [Concept map. Wikimedia Commons]
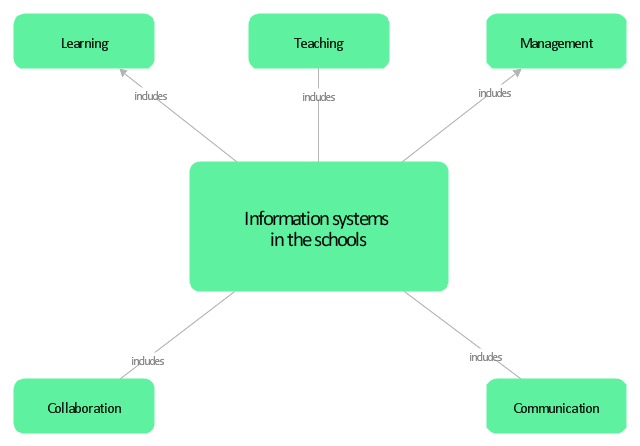
This concept map example was redesigned from the Wikimedia Commons file: Information systems in the Schools.jpg.
[commons.wikimedia.org/ wiki/ File:Information_ systems_ in_ the_ Schools.jpg]
This file is licensed under the Creative Commons Attribution-Share Alike 3.0 Unported license. [creativecommons.org/ licenses/ by-sa/ 3.0/ deed.en]
The example "Information systems in the schools" was created using the ConceptDraw PRO diagramming and vector drawing software extended with the Concept Maps solution from the area "What is a Diagram" of ConceptDraw Solution Park.
The concept map can take the shape and composition of other map types. They can take the shape of the context diagram, tree diagram or venn diagram, but other shapes and compositions are also possible. ...
A concept map can be drawn with all kinds of elements:
(1) Text and lines.
(2) Blocks and arrows.
(3) Circles.
(4) Additional text.
(5) Additional listings.
(6) Additional icons.
(7) Additional Illustration (as groundplan).
(8) Additional legenda. ...
A concept map shows a number of elements, relations and/ or properties in one or more layers. ...
The relation between the elements can be pictures with specific shapes (lines, arrow)." [Concept map. Wikimedia Commons]
This concept map example was redesigned from the Wikimedia Commons file: Information systems in the Schools.jpg.
[commons.wikimedia.org/ wiki/ File:Information_ systems_ in_ the_ Schools.jpg]
This file is licensed under the Creative Commons Attribution-Share Alike 3.0 Unported license. [creativecommons.org/ licenses/ by-sa/ 3.0/ deed.en]
The example "Information systems in the schools" was created using the ConceptDraw PRO diagramming and vector drawing software extended with the Concept Maps solution from the area "What is a Diagram" of ConceptDraw Solution Park.
Concept map
HelpDesk
What Information can be Displayed in the Multiproject Dashboard View

HelpDesk
Event-driven Process Chain (EPC) Diagram Software

Exercise your brain

- Simple Diagram The Concept Of Information System
- Chart Of Management Information System With Diagram
- Concept Of Information System
- Concept Maps | Audit Flowcharts | ConceptDraw Solution Park ...
- Organizational Pyramid And Information Concept In Management ...
- Diagram Concept Of The Automated Information System
- Concept Of Management Information System Chart
- Explain In Detail Organizational Pyramid And Information Concept
- Organizational Chart Templates | Concept Map Maker | Partnership ...
- Explain Organizational Pyramid And Information Concept With ...
- Organizational Pyramid And Information Concept In Mis
- Concept Map In Information And Communication Technology
- Flowchart Of Concept Of Financial Accounting
- Pyramid Model Concept Map
- Sketch The Concept Of An Management Information System
- 4 Level pyramid model diagram - Information systems types ...
- Choose Any Concept That Interests You And Make A Mind Map
- Building Drawing . Design Element: School Layout | Information ...
- Concept Maps | Venn Diagram Examples for Problem Solving ...
- Mis Concept Using The Pyramid Structure