This site uses cookies. By continuing to browse the ConceptDraw site you are agreeing to our Use of Site Cookies.

comparison chart, indicators Comparison Dashboard

comparison chart, indicators
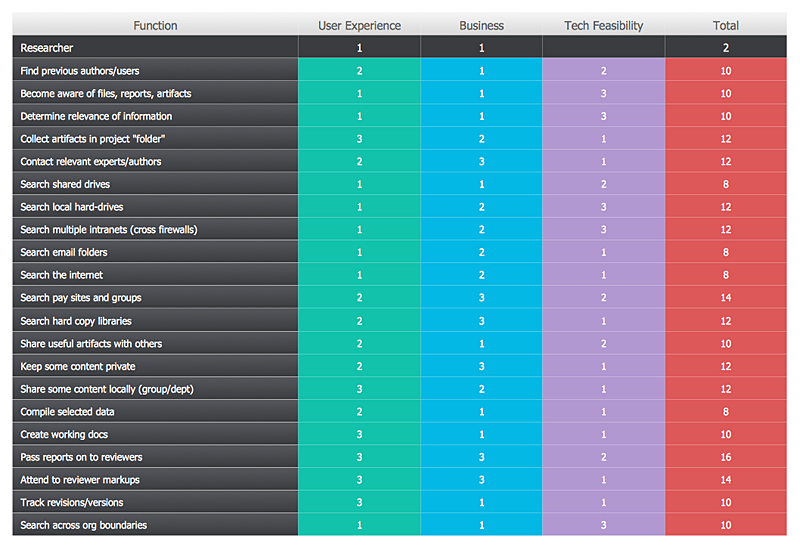
Comparison dashboard solution extends ConceptDraw DIAGRAM software with samples, templates and vector stencils library with charts and indicators for drawing the visual dashboard comparing data.
HelpDesk

How to Create a Bubble Diagram

Bubble Diagram is a simple chart that consists of circles (bubbles) repesening certain topics or processes. Bubbles are connected by lines depicting the type of relationships between the bubbles. The size of each bubble is depended on the importance of the entity it represents. Bubble charts are widely used throughout social, economical, medical, and other scientific researches as well as throughout architecture and business management. Bubble charts are often used during the early stages of product development to visualize thoughts and ideas for the purpose of sketching out a development plan. ConceptDraw DIAGRAM allows you to draw a bubble diagrams using the Bubble Diagrams solution.

ConceptDraw DIAGRAM Compatibility with MS Visio

For those who are migrating from MS Visio to ConceptDraw DIAGRAM, or for those who have colleagues and clients who use Visio, ConceptDraw DIAGRAM is compatible with MS Visio.VSDX formatted files.VSDX is Visio’s open XML file format, and it can be easily imported and exported by ConceptDraw DIAGRAM.
HelpDesk

How to Draw an Area Chart

An area chart is similar to a line chart, but an area chart has an area, commonly filled with color below the line. The applying of Line charts and area charts are also very similar. They both show continuity across a data set. They are both can be used for displaying time series data and for depicting tendencies better than separate values, but they have some different characteristics. Using the proper one is good chance to show once again professionalism of your graphics documents. An area chart depicts a colored area below the line. The sum on the vertical axis of an area chart represents the entire value, while the height of each separate piece shows its parts. Area charts are used to display multiple data series with proportion to a whole value, or for separate data series showing a set of countable values, or cumulative data.
HelpDesk

How to Create a Picture Graph

Picture Graphs are used commonly to represent non-complex data to a large audience. A Picture Graph is a simple kind of marketing diagram used to show the relationship among various quantities. It includes pictures or symbols to represent information visually. There are many cases when you have just some numbers to show and compare. This is not a reason to not use visual tools. You can produce a simple picture graph using memorable symbols to get the best visual presentation. Using specific symbols instead of regular colored bars makes picture graphs a much more descriptive tool. You can use tools from an existing library or find appropriate clipart in ConceptDraw’s collection. ConceptDraw DIAGRAM allows you to draw a simple and easy to understand Picture Charts using the special library.
HelpDesk

How To Create a Prioritization Matrix

Making the prioritization matrix is helpful when all cannot be done at the same time. Prioritization matrix diagram shows the relationships between factors and this helps, to prioritize tasks and resources. This helps you to narrow down variants. By selecting and weighing options you can quickly determine the best choices and direct team to the best destinations. Prioritization matrix helps to identify the best way of implementing the most priority tasks. It is helpful in a case when you have limited resources. ConceptDraw solution for management and planning compiled from the Seven Management and Planning Tools provides the ability to quickly build Prioritization Matrix diagrams for your project using a special template.
HelpDesk

How to Draw the Different Types of Pie Charts

Using a Pie Chart, you can visually estimate the relative contribution that different data categories contribute to a whole value. The pie chart displays the statistics in a visual format. The main use of pie charts to show comparisons. The larger piece of the pie, the more the value of this value compared to the rest. Various applications of pie charts can be found in business and education. For business, pie charts can be used to compare the success or failure of the goods or services. They may also be used to display the business market share.
HelpDesk

How to Draw a Pictorial Chart

Pictorial Infographics is used to visually present data comparison. Pictorial charts use relative sizes or repetitions of the same icon, picture, or symbol to show data relation. Using a Pictorial chart to show business data patterns and trends will add much more efficiency to your business communications. Finding the right tool for the job can sometimes be tricky. Developing sophisticated and effective infographics can require tools that may span many different products. Fortunately, ConceptDraw DIAGRAM has everything you need to create polished Pictorial Infographics that beautifully and accurately represent your story, no matter how complex it may be.

draw divided bar diagram, draw divided bar chart, draw divided bar graph Divided Bar Diagrams

draw divided bar diagram, draw divided bar chart, draw divided bar graph
The Divided Bar Diagrams Solution extends the capabilities of ConceptDraw DIAGRAM with templates, samples, and a library of vector stencils for drawing high impact and professional Divided Bar Diagrams and Graphs, Bar Diagram Math, and Stacked Graph.

Total Quality Management with ConceptDraw

Total Quality Management (TQM) system is the management method where the confidence in quality of all organization processes is placed foremost. The given method is widely used in production, in educational system, in government organizations and so on.

Basic Pie Charts, statistics, business Basic Pie Charts

Basic Pie Charts, statistics, business
This solution extends the capabilities of ConceptDraw DIAGRAM (or later) with templates, samples, and a library of vector stencils for drawing pie and donut charts.