Business diagrams & Org Charts with ConceptDraw DIAGRAM


Business Process Modeling Resume
 Event-driven Process Chain Diagrams
Event-Driven Process Chain Diagrams solution extends ConceptDraw DIAGRAM functionality with event driven process chain templates, samples of EPC engineering and modeling the business processes, and a vector shape library for drawing the EPC diagrams and EPC flowcharts of any complexity. It is one of EPC IT solutions that assist the marketing experts, business specialists, engineers, educators and researchers in resources planning and improving the business processes using the EPC flowchart or EPC diagram. Use the EPC solutions tools to construct the chain of events and functions, to illustrate the structure of a business process control flow, to describe people and tasks for execution the business processes, to identify the inefficient businesses processes and measures required to make them efficient.
"Porter five forces analysis is a framework for industry analysis and business strategy development. It draws upon industrial organization (IO) economics to derive five forces that determine the competitive intensity and therefore attractiveness of a market. Attractiveness in this context refers to the overall industry profitability. An "unattractive" industry is one in which the combination of these five forces acts to drive down overall profitability. A very unattractive industry would be one approaching "pure competition", in which available profits for all firms are driven to normal profit.
Three of Porter's five forces refer to competition from external sources. The remainder are internal threats.
Porter referred to these forces as the micro environment, to contrast it with the more general term macro environment. They consist of those forces close to a company that affect its ability to serve its customers and make a profit. A change in any of the forces normally requires a business unit to re-assess the marketplace given the overall change in industry information. The overall industry attractiveness does not imply that every firm in the industry will return the same profitability. Firms are able to apply their core competencies, business model or network to achieve a profit above the industry average. A clear example of this is the airline industry. As an industry, profitability is low and yet individual companies, by applying unique business models, have been able to make a return in excess of the industry average.
Porter's five forces include - three forces from 'horizontal' competition: the threat of substitute products or services, the threat of established rivals, and the threat of new entrants; and two forces from 'vertical' competition: the bargaining power of suppliers and the bargaining power of customers.
This five forces analysis, is just one part of the complete Porter strategic models. The other elements are the value chain and the generic strategies." [Porter five forces analysis. Wikipedia]
The block diagram example "Porter's five forces model" was created using the ConceptDraw PRO diagramming and vector drawing software extended with the Block Diagrams solution from the area "What is a Diagram" of ConceptDraw Solution Park.
Block diagram

 Business Process Diagrams
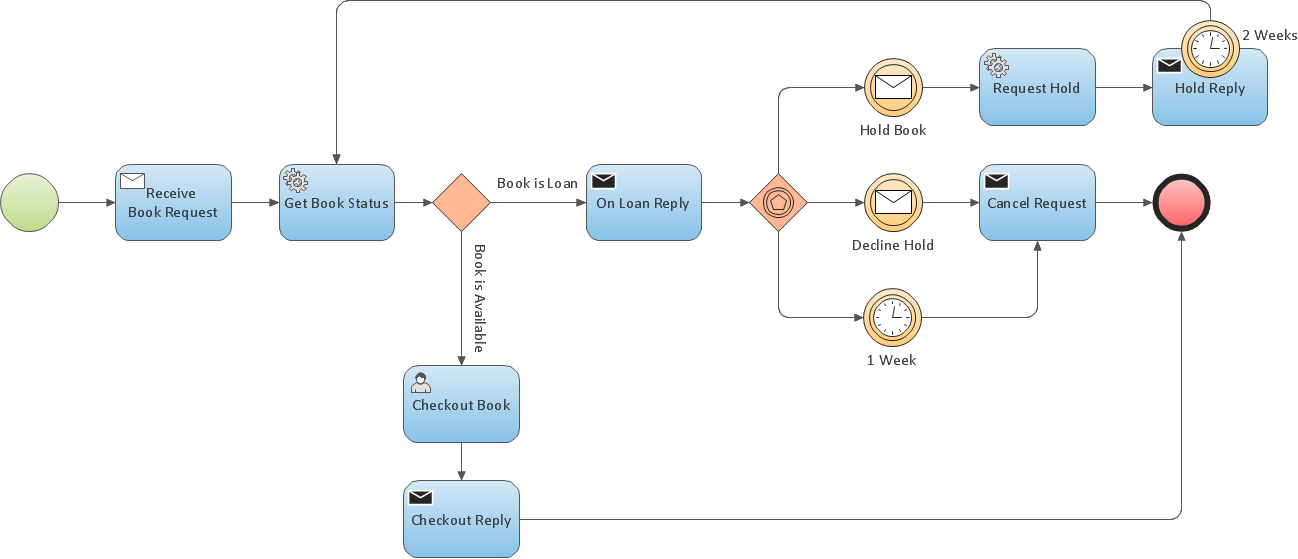
Business Process Diagrams solution extends the ConceptDraw DIAGRAM BPM software with RapidDraw interface, templates, samples and numerous libraries based on the BPMN 1.2 and BPMN 2.0 standards, which give you the possibility to visualize equally easy simple and complex processes, to design business models, to quickly develop and document in details any business processes on the stages of project’s planning and implementation.
 Management
This solution extends ConceptDraw DIAGRAM and ConceptDraw MINDMAP with Management Diagrams and Mind Maps (decision making, scheduling, thinking ideas, problem solving, business planning, company organizing, SWOT analysis, preparing and holding meetings
 Entity-Relationship Diagram (ERD)
An Entity-Relationship Diagram (ERD) is a visual presentation of entities and relationships. That type of diagrams is often used in the semi-structured or unstructured data in databases and information systems. At first glance ERD is similar to a flowch
- Business Process Diagram | Business Models | Business model ...
- Business Structure Diagram
- Organizational Structure | Matrix Organization Structure | Business ...
- Create Workflow Diagram | Business Processes | Cross-Functional ...
- Organizational Structure | Draw Company Structure with ...
- Diagram Of The Structure Of A Company
- Data Flow Diagrams | Business diagrams & Org Charts with ...
- Design Elements - Alvarion, Cisco | Using Remote Networking ...
- Business diagrams & Org Charts with ConceptDraw PRO ...
- Fishbone Diagram | Computer and Networks | Entity-Relationship ...
- Pyramid Chart Examples | Business Diagram Software | Hierarchy ...
- Block diagram - Six markets model
- How to Draw an Organization Chart | Business Diagram Software ...
- Management | Management Mind Maps | Business Productivity Area ...
- Cross-Functional Flowcharts | Create Workflow Diagram | Optimize a ...
- Business Flow Chart Of Marketing Company
- Get Drawing Project By Company
- Business Process Diagram | Basic Workflow Examples | Event ...
- Business Process Modeling Software for Mac | Flow Diagram ...
- Business Process Diagram | Business Process Modeling Resume ...