This cloud computing infographic example was drawn on the base of Wikimedia Commons file: SmartCloud model.png. [commons.wikimedia.org/ wiki/ File:SmartCloud_ model.png]
Copyleft: This work of art is free; you can redistribute it and/ or modify it according to terms of the Free Art License. [artlibre.org/ licence/ lal/ en/ ]
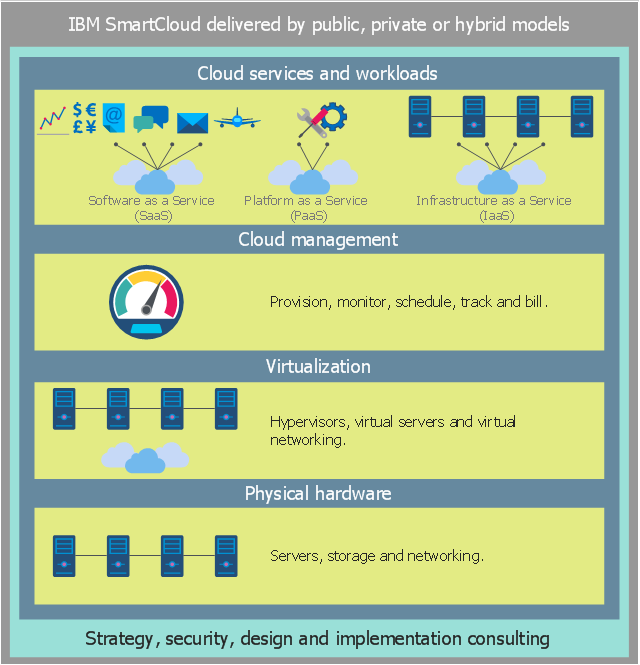
"IBM cloud computing is using for a set of cloud computing services for business offered by the information technology company IBM. All offerings used to be marketed under the name IBM SmartCloud. IBM cloud includes infrastructure as a service (IaaS), software as a service (SaaS) and platform as a service (PaaS) offered through public, private and hybrid cloud delivery models, in addition to the components that make up those clouds." [IBM cloud computing. Wikipedia]
The infographic example "SmartCloud model" was drawn using ConceptDraw PRO software extended with the Cloud Computing Diagrams solution from the Computer and Networks area of ConceptDraw Solution Park.
Copyleft: This work of art is free; you can redistribute it and/ or modify it according to terms of the Free Art License. [artlibre.org/ licence/ lal/ en/ ]
"IBM cloud computing is using for a set of cloud computing services for business offered by the information technology company IBM. All offerings used to be marketed under the name IBM SmartCloud. IBM cloud includes infrastructure as a service (IaaS), software as a service (SaaS) and platform as a service (PaaS) offered through public, private and hybrid cloud delivery models, in addition to the components that make up those clouds." [IBM cloud computing. Wikipedia]
The infographic example "SmartCloud model" was drawn using ConceptDraw PRO software extended with the Cloud Computing Diagrams solution from the Computer and Networks area of ConceptDraw Solution Park.
Cloud computing infographic
 ConceptDraw Solution Park
ConceptDraw Solution Park collects graphic extensions, examples and learning materials
 Project Management Area
Project Management area provides Toolbox solutions to support solving issues related to planning, tracking, milestones, events, resource usage, and other typical project management functions.
ConceptDraw Solution Park
ConceptDraw Solution Park collects graphic extensions, examples and learning materials
 Seven Basic Tools of Quality
Manage quality control in the workplace, using fishbone diagrams, flowcharts, Pareto charts and histograms, provided by the Seven Basic Tools of Quality solution.
- Cloud Based Services
- What Is A Cloud Based Solution
- Cloud Computing Architecture | Windows Azure | Mobile satellite TV ...
- Cloud Computing
- Cloud Computing Architecture
- Cloud Computing Architecture Diagrams | Design elements - Azure ...
- Microsoft Azure | Azure Storage | Azure Architecture | Cloud Platform
- 2-Tier Auto-scalable Web Application Architecture in 1 AZ | 2-Tier ...
- Vector Table And Humans
- Interactive Voice Response Diagrams | Wireless broadband network ...
- Public Services Network Diagram
- Mobile TV Web-based network diagram | Telecommunication ...
- Mobile satellite TV network diagram | Interactive Voice Response ...
- Store Cloud
- Diagram On Communication Services Of Internet
- Mobile satellite communication network diagram | Mobile satellite TV ...
- Cisco Multimedia, Voice, Phone. Cisco icons, shapes, stencils and ...
- Telecommunication Network Diagrams | Mobile satellite ...
- Transceiver
- Mobile TV Web-based network diagram