The vector stencils library "Weather" contains 17 weather clipart images for drawing illustrations on climate to show cloudiness, air temperature, precipitation, wind.
"Weather is the state of the atmosphere, to the degree that it is hot or cold, wet or dry, calm or stormy, clear or cloudy. Most weather phenomena occur in the troposphere, just below the stratosphere. Weather generally refers to day-to-day temperature and precipitation activity, whereas climate is the term for the average atmospheric conditions over longer periods of time. When used without qualification, "weather", is generally understood to mean the weather of Earth.
Weather is driven by air pressure (temperature and moisture) differences between one place and another. These pressure and temperature differences can occur due to the sun angle at any particular spot, which varies by latitude from the tropics. The strong temperature contrast between polar and tropical air gives rise to the jet stream. Weather systems in the mid-latitudes, such as extratropical cyclones, are caused by instabilities of the jet stream flow. Because the Earth's axis is tilted relative to its orbital plane, sunlight is incident at different angles at different times of the year. On Earth's surface, temperatures usually range ±40°C (−40°F to 100°F) annually. Over thousands of years, changes in Earth's orbit affect the amount and distribution of solar energy received by the Earth and influence long-term climate and global climate change." [Weather. Wikipedia]
The clip art example "Weather - Vector stencils library" was created using the ConceptDraw PRO diagramming and vector drawing software extended with the Nature solution from the Illustration area of ConceptDraw Solution Park.
www.conceptdraw.com/ solution-park/ illustrations-nature
Sunny

Cloudy

Overcast

Snow

Rain

Lightning

Hot

Warm

Frost

Mist

Strong wind

Flood

Tsunami

Dew

Hoar-frost

Earthquake

Snowflake

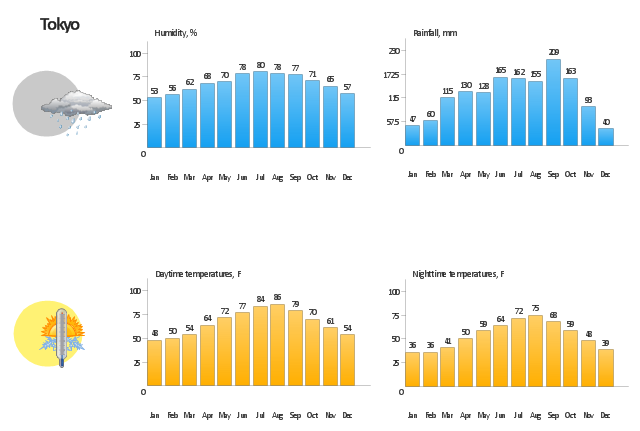
This weather conditions dashboard example depicting climate in Tokyo was drawn using the ConceptDraw PRO diagramming and vector graphics software extended with the clipart library Weather.
"Meteorology is the interdisciplinary scientific study of the atmosphere. ...
Meteorological phenomena are observable weather events which illuminate, and are explained by the science of meteorology. Those events are bound by the variables that exist in Earth's atmosphere; temperature, air pressure, water vapor, and the gradients and interactions of each variable, and how they change in time. Different spatial scales are studied to determine how systems on local, regional, and global levels impact weather and climatology." [Meteorology. Wikipedia]
This weather conditions dashboard example is included in the Nature solution from the Illustration area of ConceptDraw Solution Park.
Infographics
 Basic Pie Charts
This solution extends the capabilities of ConceptDraw DIAGRAM (or later) with templates, samples, and a library of vector stencils for drawing pie and donut charts.
- Water Vapour Clipart
- Water Vapour Diagram
- Water cycle diagram | Water Vapor Cycle In Nature
- Water Vapor
- Water cycle diagram | Clipart On Water Vapor
- Water cycle diagram | Sea Water Vapor Png Clipart
- Easy Drawings Of Water Vapour
- Water Vapor Clipart
- Easy Water Vapor Drawing
- Water cycle diagram | Geo Map of Americas | River Rain Clipart