HelpDesk
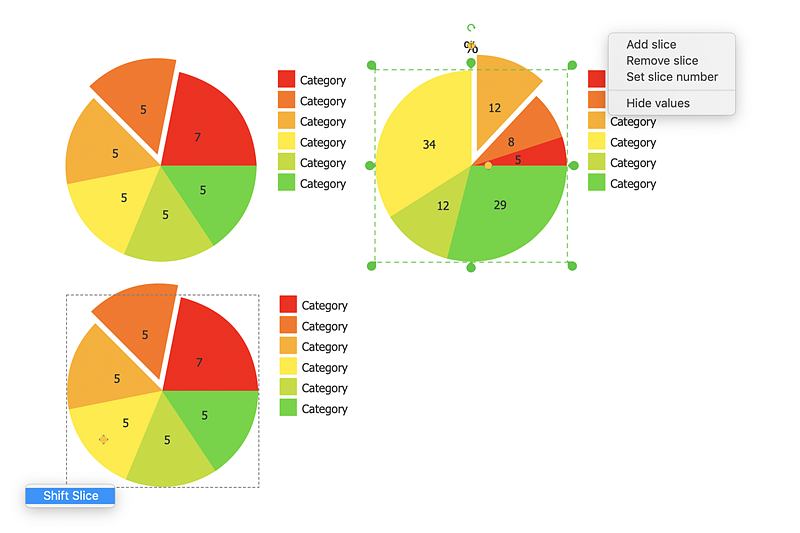
How to Draw the Different Types of Pie Charts
Using the Pie Chart, you can visually estimate the relative contribution that different data categories contribute to a whole value. The pie chart displays the statistics in a visual format. The main use of pie charts to show comparisons. The larger piece of the pie, the more the value of this value compared to the rest. Various applications of pie charts can be found in business and education. For business, pie charts can be used to compare the success or failure of the goods or services. They may also be used to display the business market share.HelpDesk
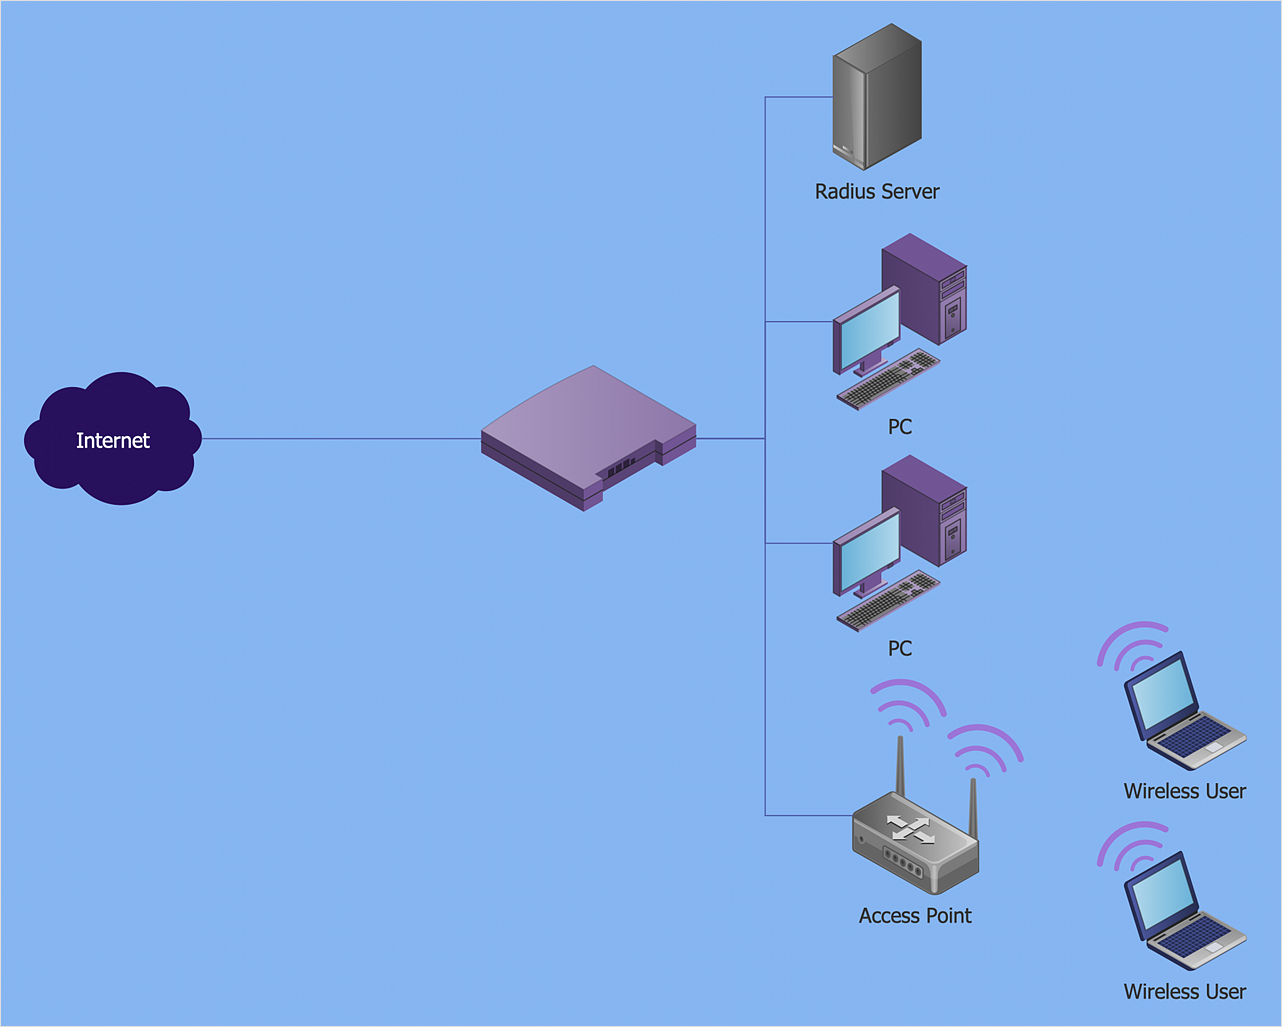
How to Create a Wireless Network Diagram Using ConceptDraw Solutions
A wireless network diagram is a specialized type of computer network diagrams. Wireless Network diagrams are used to develop, operate and maintain the WLAN systems. Making a Wireless Network diagram involves many different elements that can be managed using ConceptDraw DIAGRAM. With ConceptDraw DIAGRAM you can easily create and communicate the Wireless Network diagram of any complexity.HelpDesk
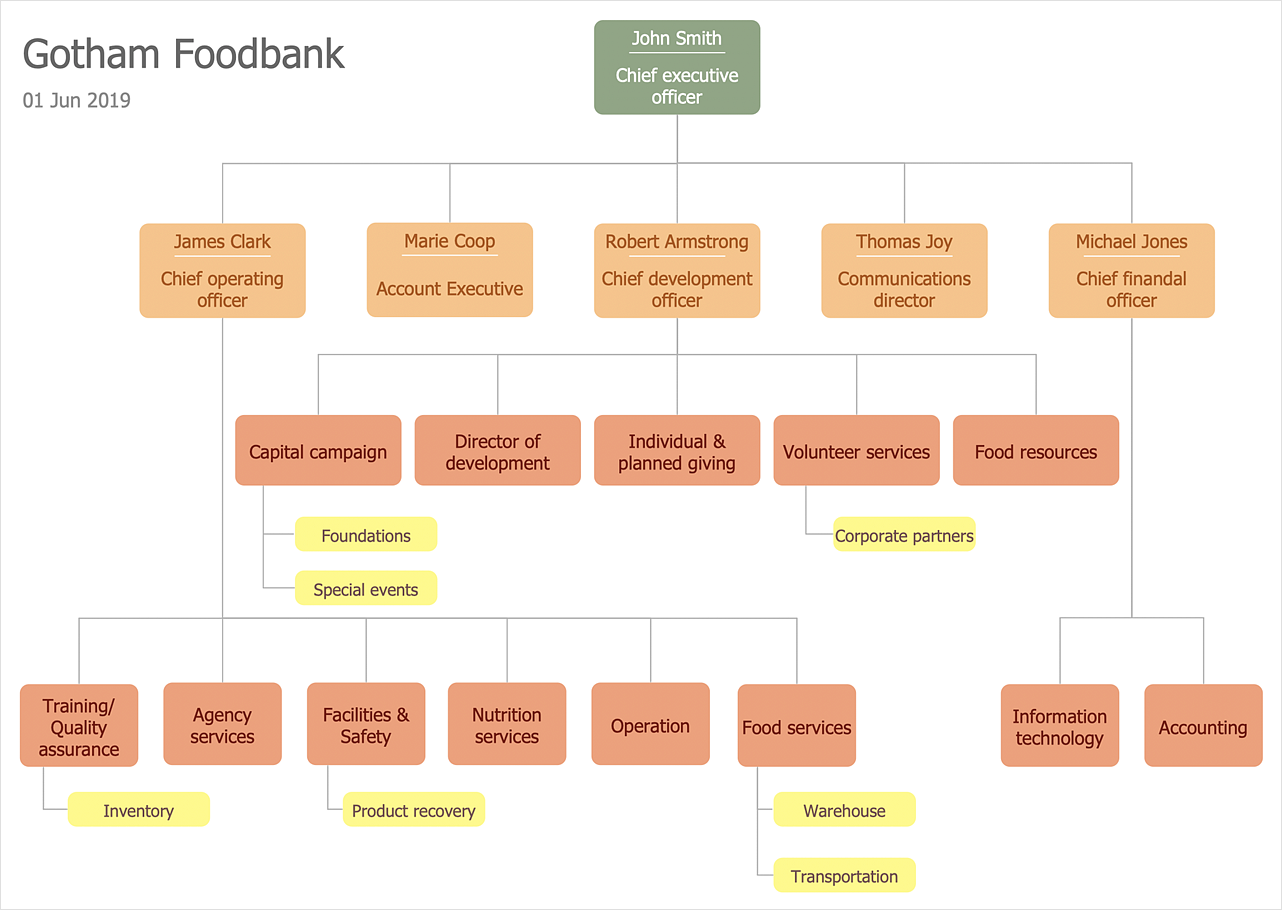
How to Draw an Organizational Chart
Polish your diagram appearance using the tools provided in the Format panel. The organizational chart software is a valuable tool for modern business. It is important for any business to build a clear organizational structure that determines the responsibilities and relationships between different positions in the organization. The clear structured organization - means the clear structured business workflow, which is the core of success in the business. ConceptDraw DIAGRAM is an org chart software that allows you to draw an organizational structure of your company quickly and easily.Cisco Network Templates
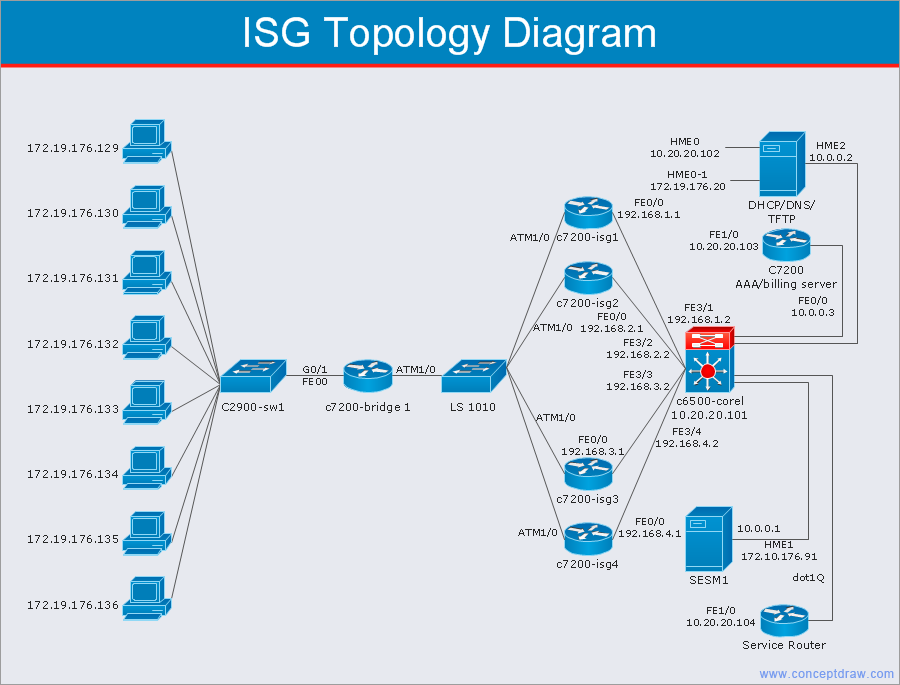
Cisco is a huge multinational company that develops and sells worldwide the]network equipment, mainly for large organizations and telecommunication companies. So, it has large number of enterprise clients in a corporate environment. Therefore many network engineers often draw the Network diagrams for Cisco hardware and are needed in a powerful vector drawing software. ConceptDraw DIAGRAM is ideal for this goal, enhanced with professional Cisco Network Diagrams solution from Computer and Networks area of ConceptDraw Solution Park it offers a wide variety of vector design objects libraries, samples and also large set of Cisco network templates. The use of templates is the easiest and time-saving way of drawing professional-looking diagrams and schematics. Use them to design Cisco Network Topologies, Cisco Network Diagrams, Cisco ISG Topology Diagrams, Cisco Express Forwarding Diagrams, Rack Diagrams, Network Organization Charts, Wireless Computer Network Diagrams, Vehicular Network Diagrams, and many other types of diagrams without efforts.
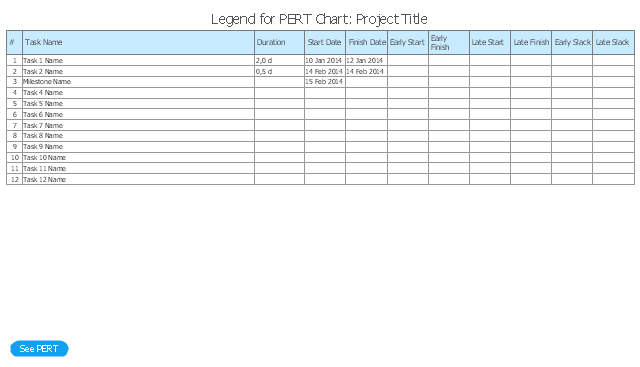
The PERT chart shows the logical connections and consequence of a set of tasks. PERT charts the time period for problem solving and the implementation plan for all activities along the critical path. The PERT chart is also known as a precedence diagram or project network diagram.
"The Program (or Project) Evaluation and Review Technique, commonly abbreviated PERT, is a statistical tool, used in project management, that is designed to analyze and represent the tasks involved in completing a given project. ...
PERT is a method to analyze the involved tasks in completing a given project, especially the time needed to complete each task, and to identify the minimum time needed to complete the total project.
PERT was developed primarily to simplify the planning and scheduling of large and complex projects. ...
A network diagram can be created by hand or by using diagram software. There are two types of network diagrams, activity on arrow (AOA) and activity on node (AON). Activity on node diagrams are generally easier to create and interpret." [Program Evaluation and Review Technique. Wikipedia]
The PERT chart is one of the Seven Management and Planning Tools (7 MP tools, Seven New Quality Tools).
The PERT chart template for the ConceptDraw PRO diagramming and vector drawing software is included in the solution "Seven Management and Planning Tools" from the Management area of ConceptDraw Solution Park.
HelpDesk
How to Create a Bar Chart
Bar charts (bar graphs) are diagrams displaying data as horizontal or vertical bars of certain heights. Bar charts are widely used to show and compare the values of the same parameters for different data groups. The bar graph can be vertical or horizontal. This depends on the number of categories. There are many methods in which bar graph can be built and this makes it a very often used chart type. Usually, a bar chart is created so that the bars are placed vertically. Such an arrangement means that the bar's height value is proportional to the category value. Nevertheless, a bar chart can be also drawn horizontally. This means that the longer the bar, the bigger the category. Thus, a bar chart is a good way to present the relative values of different measured items. The ConceptDraw Bar Graphs solution allows you to draw a bar chart quickly using a vector library, containing the set of various bar charts objects.- Create A Chart Showing Type Of Networking And Its Uses
- Types Of Networks Lan Wan Man All In One Chart With Diagram
- Flow Process Chart Man Type Examples
- How To Create A Perfect Network Chart
- Flow Process Chart Equipment Type
- Pie Chart Word Template. Pie Chart Examples | HVAC Plans ...
- Activity Network (PERT) Chart | Activity Network Diagram Method ...
- Flow process chart
- Network Glossary Definition | Network diagrams with ConceptDraw ...
- ConceptDraw PRO Network Diagram Tool | Examples of Flowcharts ...
- Examples of Flowcharts, Org Charts and More | Pie Chart Software ...
- UML Diagram Types List | Organizational Structure | Network ...
- All Types Of Network Diagrams
- Difference In Man Type And Material Type Of Flow Chart
- Activity Network (PERT) Chart | PERT chart - Template | How To ...
- Campus Area Networks (CAN). Computer and Network Examples ...
- Network organization chart | Computer Network Diagrams | Cisco ...
- Telecommunication Network Diagrams | Telecommunication ...
- Examples of Flowcharts, Org Charts and More | Local area network ...
- Examples of Flowcharts, Org Charts and More | Matrix Organization ...
