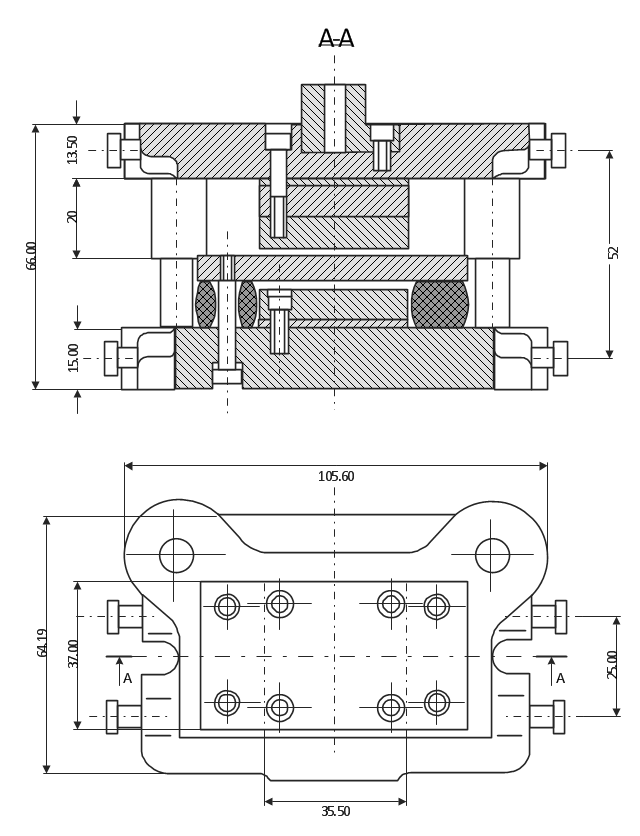
This technical drawing shows the machine parts assembly using joining by threaded fasteners.
"Assembling (joining of the pieces) is done by welding, binding with adhesives, riveting, threaded fasteners, or even yet more bending in the form of a crimped seam. Structural steel and sheet metal are the usual starting materials for fabrication, along with the welding wire, flux, and fasteners that will join the cut pieces. As with other manufacturing processes, both human labor and automation are commonly used. The product resulting from fabrication may be called a fabrication. Shops that specialize in this type of metal work are called fab shops. The end products of other common types of metalworking, such as machining, metal stamping, forging, and casting, may be similar in shape and function, but those processes are not classified as fabrication." [Metal fabrication. Wikipedia]
This mechanical engineering drawing example was designed using ConceptDraw PRO diagramming and vector drawing software extended with Mechanical Engineering solution from Engineering area of ConceptDraw Solution Park.
Pareto Chart

HelpDesk
How to Draw a Pareto Chart Using ConceptDraw PRO

- Technical drawing - Machine parts assembling | Casting Drawing Vs ...
- Casting Drawings In Engineering
- Seven Basic Tools of Quality | Pareto Chart | Technical drawing ...
- Casting Drawing Symbol
- Basic Flowchart Symbols and Meaning | Technical drawing ...
- Symbols Used In Casting And Forging
- Technical drawing - Machine parts assembling | Mechanical ...
- Technical drawing - Machine parts assembling | Biology Drawing ...
- Casting Factory Layout
- Process Flowchart | Technical drawing - Machine parts assembling ...
- Technical drawing - Machine parts assembling | Process Flowchart ...
- Mechanical Drawing Symbols | Electrical Symbols, Electrical ...
- Mechanical Drawing Symbols | Technical drawing - Machine parts ...
- Mechanical Engineering | Technical Drawing Software | How to ...
- Mechanical Drawing Symbols | Technical drawing - Machine parts ...
- Technical drawing - Machine parts assembling | Electrical Symbols ...
- Technical drawing - Machine parts assembling | Techanical Drawing ...
- Technical drawing - Machine parts assembling | Total Quality ...
- Mechanical Drawing Symbols | Technical drawing - Machine parts ...
- Technical Drawing Software | Mechanical Drawing Symbols ...