HelpDesk
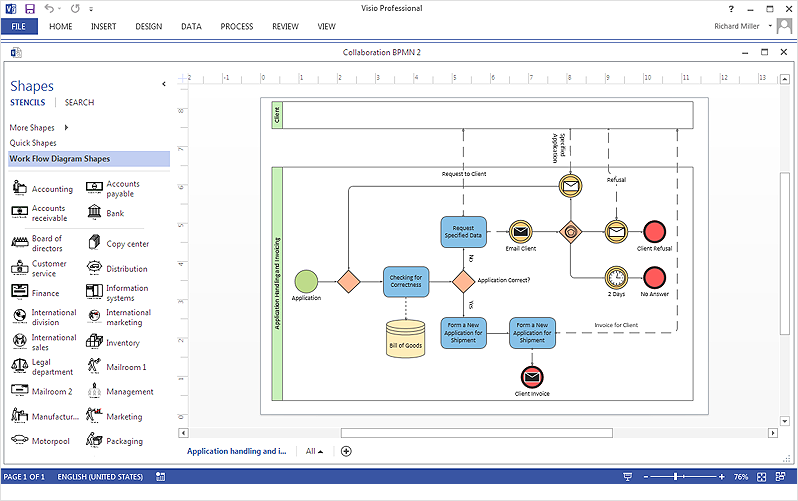
How To Create a MS Visio Business Process Diagram
Business process diagrams are specialized types of flowcharts based on the Business Process Model and Notation. The BPMN specification describes the symbols to display business processes in the form of business process diagrams. The main objective of BPMN is to create a standard set of symbols that are understandable to all business users, such as business analysts who create and improve processes, technical developers responsible for implementing processes and managers who take care processes and control them. Making a business process diagram involves many different elements that can be managed using ConceptDraw DIAGRAM. The ability to design Business process diagrams is delivered by the Business Process Diagrams solution. ConceptDraw DIAGRAM supports export of business process diagrams to MS Visio files. Thus, you can share your business documentation with MS Visio users.HelpDesk
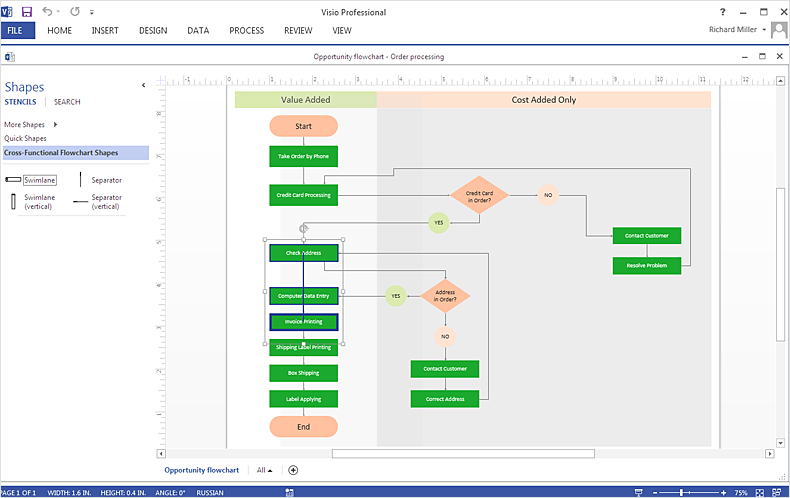
How To Create MS Visio Cross-Functional Flowchart
Cross-functional is a process involving several functional layers. Such processes typically cause the most problems, and therefore, is the most potential for improvement. Cross-functional business processes usually illustrate the processes of product development, commercial proposal development, the order execution process - everything, that involves several departments. The package of possible improvements - is the task of re-engineering. To illustrate the cross-functional processes often use cross-functional flowchart is often used to illustrate the cross-functional processes. ConceptDraw DIAGRAM allows you to easily create a cross-functional flowchart. Then, you can export it to MS Visio VSDX or VDX format and successfully share it with your colleagues still using MS Visio.HelpDesk
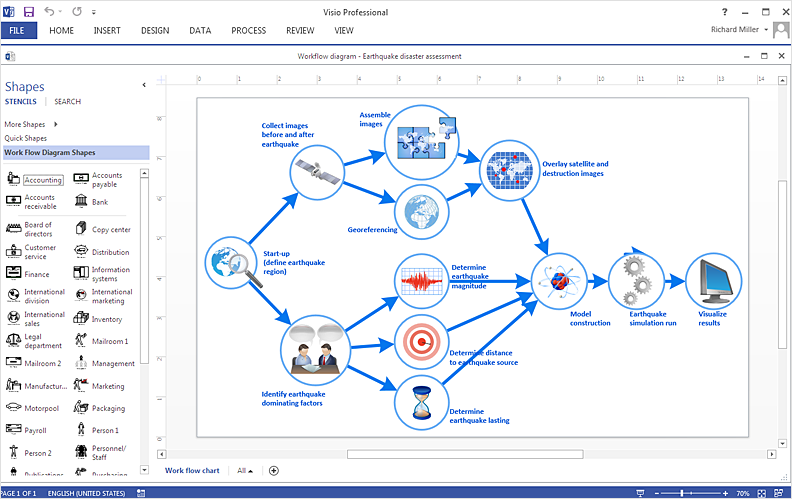
How To Create a Workflow Diagram in Visio
A workflow diagram shows a working process as a set of related events that follow each other in a particular order. They are usually created as flowcharts, with shapes that represent steps in the process connected by arrows that indicate the next step. Making a business process diagram involves many elements that can be managed using ConceptDraw DIAGRAM. The ability to design workflow diagrams is delivered by the Workflow Diagrams solution. ConceptDraw DIAGRAM allows you to easily create workflow diagrams and then make an MS Visio file from your diagrams. Using ConceptDraw DIAGRAM, you can export your workflow diagrams to MS Visio VSDX and VDX files.ConceptDraw DIAGRAM Compatibility with MS Visio
The powerful diagramming and business graphics tools are now not exception, but the norm for today’s business, which develop in incredibly quick temp. But with the abundance of powerful business diagramming applications it is important to provide their compatibility for effective exchange the information between the colleagues and other people who maybe use different software in their work. During many years Microsoft Visio™ was standard file format for the business and now many people need the visual communication software tools that can read the Visio format files and also export to Visio format. The powerful diagramming and vector drawing software ConceptDraw DIAGRAM is ideal from the point of view of compatibility with MS Visio. Any ConceptDraw DIAGRAM user who have the colleagues that use MS Visio or any who migrates from Visio to ConceptDraw DIAGRAM , will not have any problems. The VSDX (Visio′s open XML file format) and VDX formatted files can be easily imported and exported by ConceptDraw DIAGRAM , you can see video about this possibility.HelpDesk
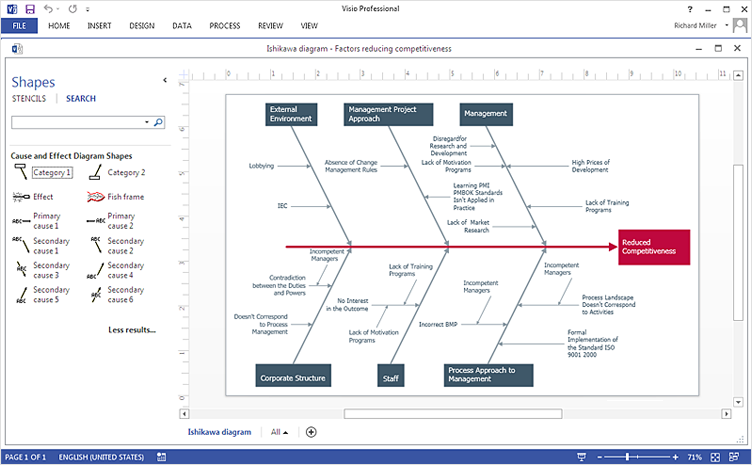
How To Create Cause and Effect (Fishbone) Diagram in MS Visio
Cause-and-Effect Ishikawa Diagram is a graphical method of analysis and cause-effect relationships, a tool in the form of fish bone. It is used to systematically determine the cause of the problem and represent it graphically. The technique is primarily used in the framework of quality management for the analysis of quality problems and their causes. Nowadays, it has found worldwide distribution and is used in multiple problem areas. It is one of the tools of lean manufacturing, which is used in group work to find the problems and their causes. ConceptDraw DIAGRAM allows you to easily create Fishbone (Ishikawa) diagram and then make a MS Visio VSDX, or VSD files from your diagrams in a couple clicks, using the export capabilities of ConcewptDraw DIAGRAM.HelpDesk
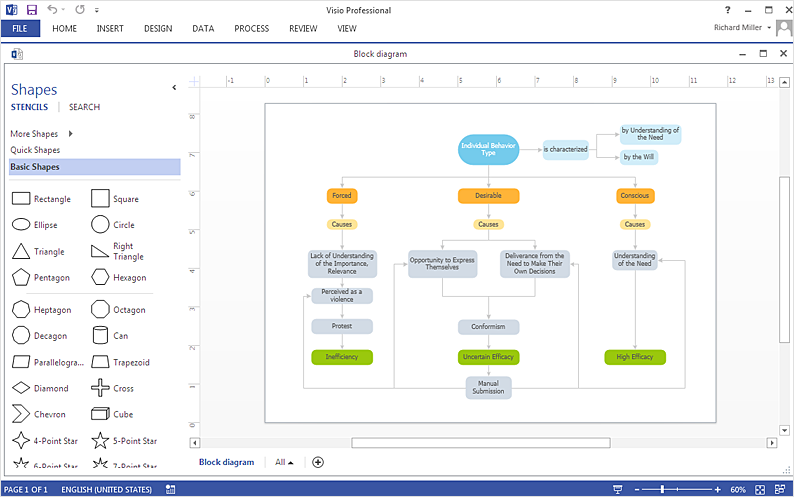
How To Create an MS Visio Block Diagram
ConceptDraw DIAGRAM allows you to easily create block diagrams of any complexity and then make an MS Visio file from your diagram in a single click.HelpDesk
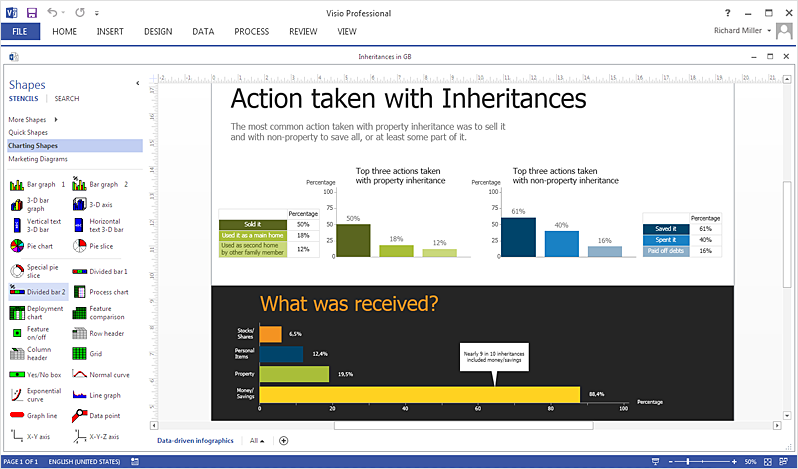
How To Create an MS Visio Data-Driven Infographics
ConceptDraw DIAGRAM allows you to easily create data-driven infographics of any complexity and then make an MS Visio file from your diagram in a few simple steps.- Basic Flowchart Symbols and Meaning | Process Flowchart | Data ...
- Cross Functional Flowchart Visio Examples
- Visio Examples Process Flow With Swim Lanes
- How To Create a MS Visio Business Process Diagram Using ...
- Process Flowchart | How to Create an Azure Architecture Diagram ...
- Process Flow Diagram Visio
- Swim Lane Diagrams | Cross-Functional Flowchart | MS Visio Look ...
- ConceptDraw PRO Compatibility with MS Visio | Process Flowchart ...
- Process Flowchart
- ConceptDraw PRO Compatibility with MS Visio | Process Flowchart ...
- Business Process Flowchart Symbols
- Flowchart Software | How To Create a MS Visio Business Process ...
- Swim Lane Diagrams | Cross-Functional Flowchart (Swim Lanes ...
- How To Create a MS Visio Business Process Diagram Using ...
- Business Context Diagram Visio
- Flowchart Software | Process Flowchart | Basic Flowchart Symbols ...
- Flowchart Software | Process Flowchart | Chemical and Process ...
- Visio Samples Of Business Procedure Flow
- How To Create a MS Visio Business Process Diagram Using ...
- Process Flowchart | Basic Flowchart Symbols and Meaning | Export ...
