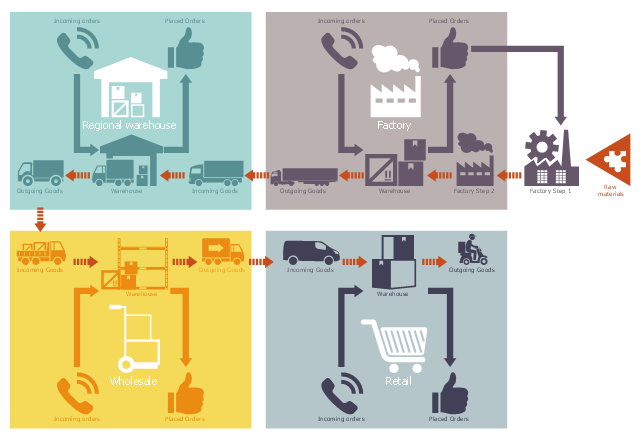
This logistic flow chart sample shows a board design for the beer distribution game.
It was designed on the base of the Wikimedia Commons file: Beer Distribution Game Board.JPG. [commons.wikimedia.org/ wiki/ File:Beer_ Distribution_ Game_ Board.JPG]
This file is licensed under the Creative Commons Attribution-Share Alike 3.0 Unported license. [creativecommons.org/ licenses/ by-sa/ 3.0/ deed.en]
"The beer distribution game (also known as the beer game) is an experiential learning business simulation game created by a group of professors at MIT Sloan School of Management in early 1960s to demonstrate a number of key principles of supply chain management. The game is played by teams of at least four players, often in heated competition, and takes at least one hour to complete. A debriefing session of roughly equivalent length typically follows to review the results of each team and discuss the lessons involved.
The purpose of the game is to understand the distribution side dynamics of a multi-echelon supply chain used to distribute a single item, in this case, cases of beer." [Beer distribution game. Wikipedia]
The logistic flowchart example "Beer distribution game" was created using ConceptDraw PRO diagramming and vector drawing software extended with the Logistics Flow Charts solution from the Business Processes area of ConceptDraw Solution Park.
Logistic flowchart
 Logistics Flow Charts
Logistics Flow Charts solution extends ConceptDraw DIAGRAM functionality with opportunities of powerful logistics management software. It provides large collection of predesigned vector logistic symbols, pictograms, objects and clipart to help you design with pleasure Logistics flow chart, Logistics process flow diagram, Inventory flow chart, Warehouse flowchart, Warehouse management flow chart, Inventory control flowchart, or any other Logistics diagram. Use this solution for logistics planning, to reflect logistics activities and processes of an enterprise or firm, to depict the company's supply chains, to demonstrate the ways of enhancing the economic stability on the market, to realize logistics reforms and effective products' promotion.
 Cafe and Restaurant Floor Plans
Restaurants and cafes are popular places for recreation, relaxation, and are the scene for many impressions and memories, so their construction and design requires special attention. Restaurants must to be projected and constructed to be comfortable and e
Entity Relationship Diagram - ERD - Software for Design Crows Foot ER Diagrams
_Win_Mac.png)

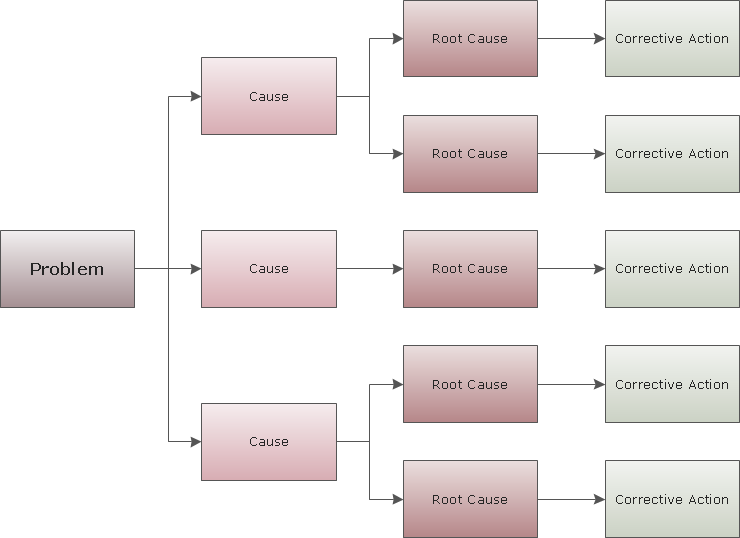
Cause and Effect Analysis

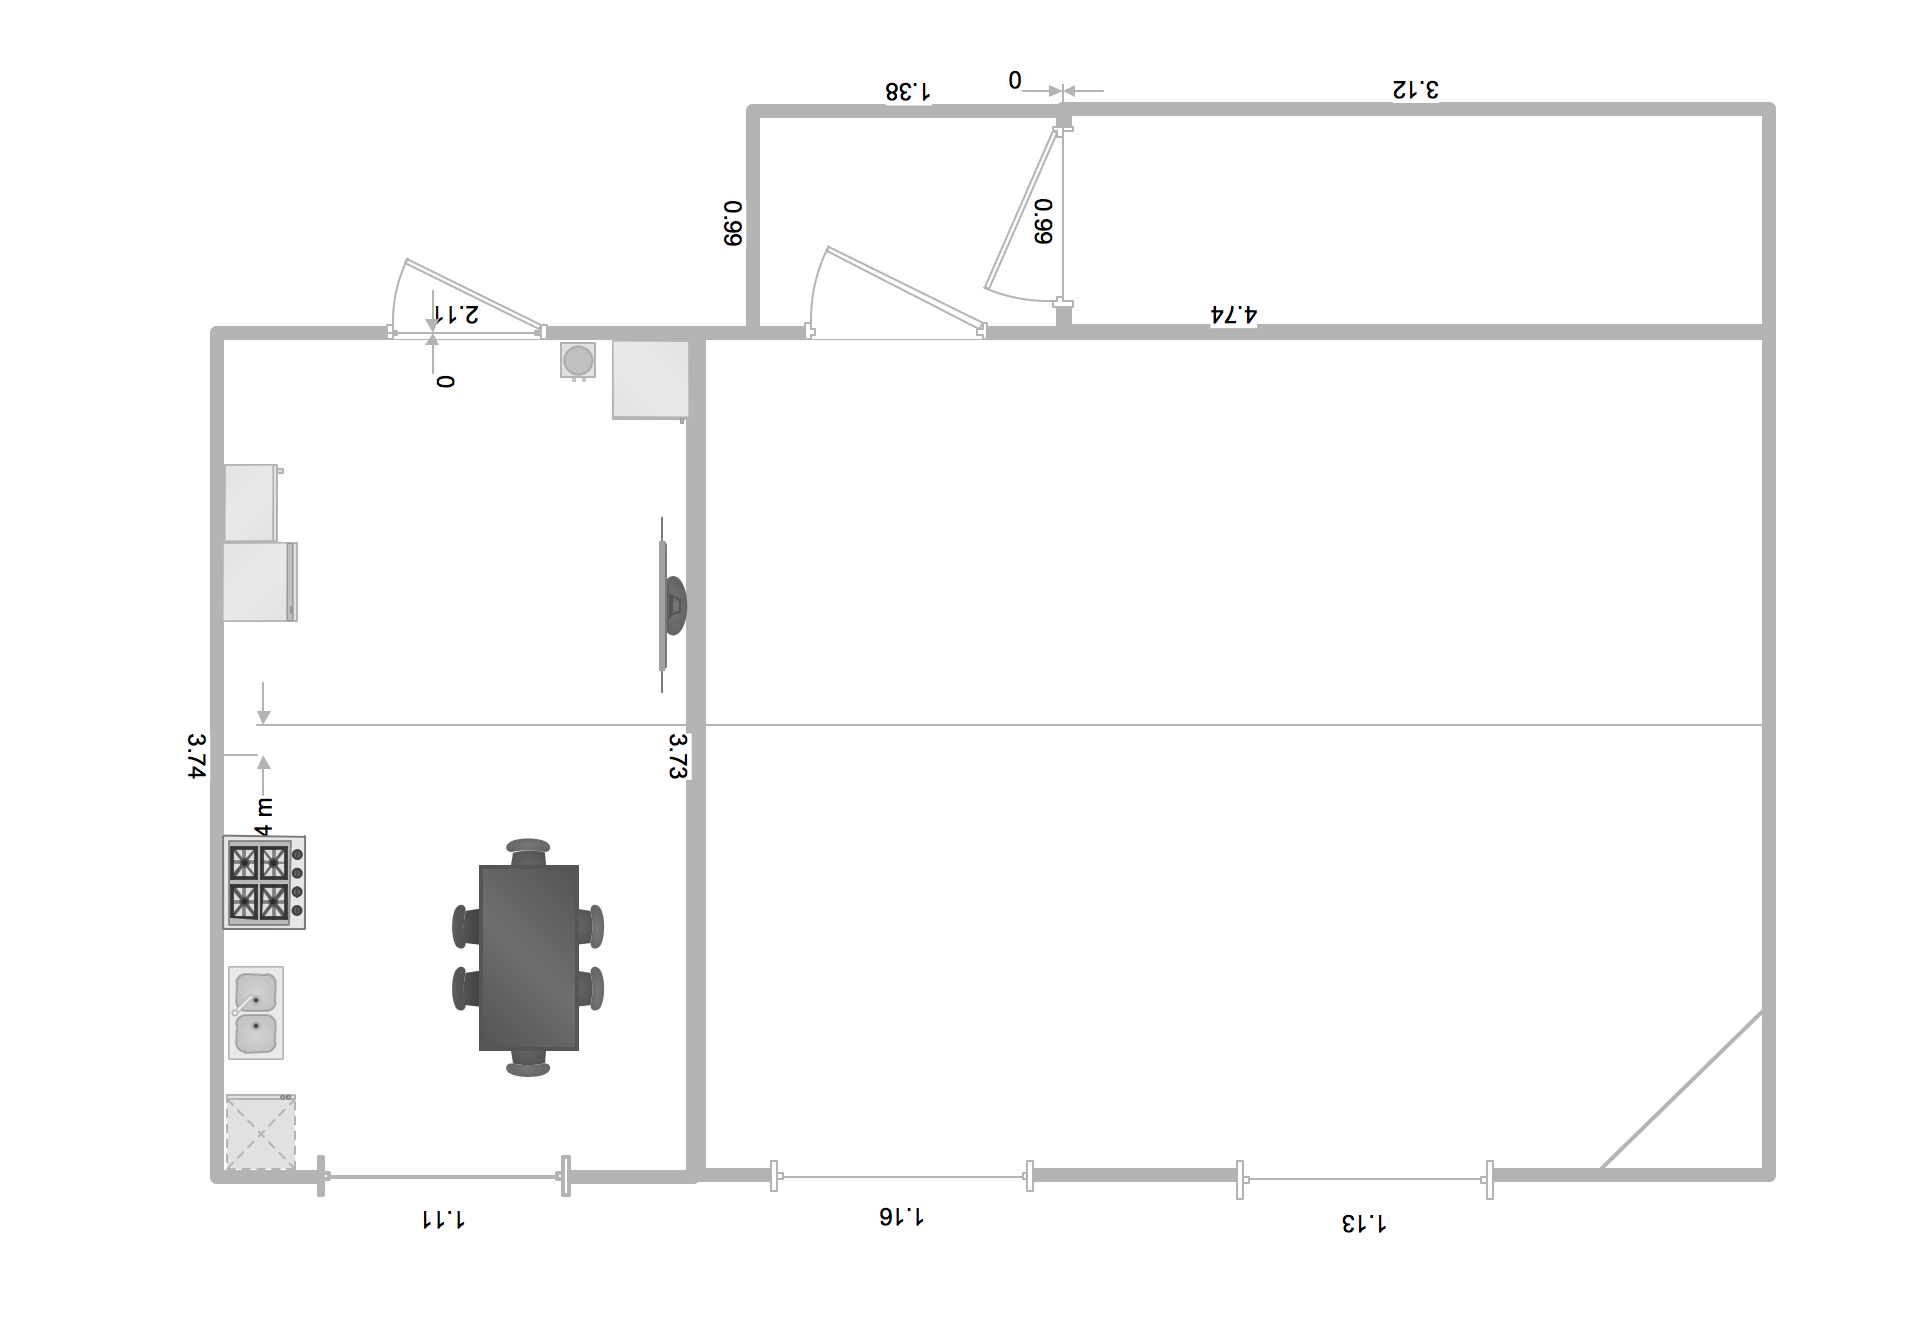
Remodel Kitchen. Building Examples
- Game Flowchart Example
- Logistics Flow Charts | Flow Chart Symbols | Distribution flowchart ...
- Intermodal transport chain | Supply chain network | Logistics Flow ...
- Data Flow Diagram For A Multiplayer Shooting Game
- Logistic Transportation Chart
- Security system floor plan | Plumbing and Piping Plans | Design ...
- Design elements - Appliances | Appliances - Vector stencils library ...
- Active indirect water heater diagram | Flat plumbing plan ...