This picture bar graph sample shows regional population growth from 2010 to 2016. It was designed using data from the Wikipedia article List of continents by population.
[en.wikipedia.org/ wiki/ List_ of_ continents_ by_ population]
"Population geography is a division of human geography. It is the study of the ways in which spatial variations in the distribution, composition, migration, and growth of populations are related to the nature of places. Population geography involves demography in a geographical perspective. It focuses on the characteristics of population distributions that change in a spatial context." [Population geography. Wikipedia]
The pictorial chart example "Regional population growth from 2010 to 2016" was created using the ConceptDraw PRO diagramming and vector drawing software extended with the Picture Graphs solution from the Graphs and Charts area of ConceptDraw Solution Park.
Image chart

 Picture Graphs
Typically, a Picture Graph has very broad usage. They many times used successfully in marketing, management, and manufacturing. The Picture Graphs Solution extends the capabilities of ConceptDraw DIAGRAM with templates, samples, and a library of professionally developed vector stencils for designing Picture Graphs.
 Bar Graphs
The Bar Graphs solution enhances ConceptDraw DIAGRAM functionality with templates, numerous professional-looking samples, and a library of vector stencils for drawing different types of Bar Graphs, such as Simple Bar Graph, Double Bar Graph, Divided Bar Graph, Horizontal Bar Graph, Vertical Bar Graph, and Column Bar Chart.
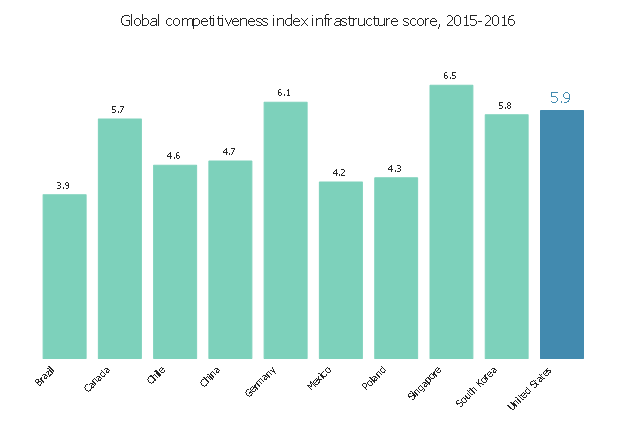
This vertical bar chart sample shows the global competitiveness index infrastructure score in 2015-2016. It was designed using data from the website "Assess Costs Everywhere (ACE)" of the United States Department of Commerce. [acetool.commerce.gov/ shipping]
"The Global Competitiveness Report (GCR) is a yearly report published by the World Economic Forum. Since 2004, the Global Competitiveness Report ranks countries based on the Global Competitiveness Index, developed by Xavier Sala-i-Martin and Elsa V. Artadi. Before that, the macroeconomic ranks were based on Jeffrey Sachs's Growth Development Index and the microeconomic ranks were based on Michael Porter's Business Competitiveness Index. The Global Competitiveness Index integrates the macroeconomic and the micro/ business aspects of competitiveness into a single index." [Global Competitiveness Report. Wikipedia]
The column graph example "Global competitiveness index infrastructure score chart" was created using the ConceptDraw PRO diagramming and vector drawing software extended with the Bar Graphs solution from the Graphs and Charts area of ConceptDraw Solution Park.
Vertical bar graph
Create Graphs and Charts

This picture bar graph sample shows the computer and Internet use at home from 1984 to 2014. It was designed using data from website of the United States Census Bureau (USCB).
[census.gov/ content/ dam/ Census/ library/ visualizations/ 2016/ comm/ digital_ nation.png]
"Home automation is the residential extension of building automation and involves the control and automation of lighting, heating, ventilation, air conditioning (HVAC), appliances, and security. Modern systems generally consist of switches and sensors connected to a central hub sometimes called a "gateway" from which the system is controlled with a user interface that is interacted either with a wall-mounted terminal, mobile phone software, tablet computer or a web interface." [Home automation. Wikipedia]
The pictorial chart example "Computer and Internet use at home over time" was created using the ConceptDraw PRO diagramming and vector drawing software extended with the Picture Graphs solution from the Graphs and Charts area of ConceptDraw Solution Park.
Image chart

Chart Templates

Chart Examples

Pie Graph Worksheets

 Project Exchange
This solution extends ConceptDraw PROJECT and ConceptDraw MINDMAP software with the ability to import and export project data.
- Basic Diagramming | Regional population growth from 2010 to 2016 ...
- Rainfall Bar Chart | Chart Maker for Presentations | Picture Graph ...
- Barrie population - Picture bar graph | Regional population growth ...
- Regional population growth from 2010 to 2016 | Global ...
- Line Graph | Population growth by continent | Line Chart Examples ...
- Design elements - Picture bar graphs | Picture graphs - Vector ...
- Chart Templates | Pie Charts | Basic Line Graphs | Increase The ...
- Population Bar Chart
- Population growth by continent | Pictures of Graphs | Picture Graph ...
- Continent Maps | Philippines Population Graphs