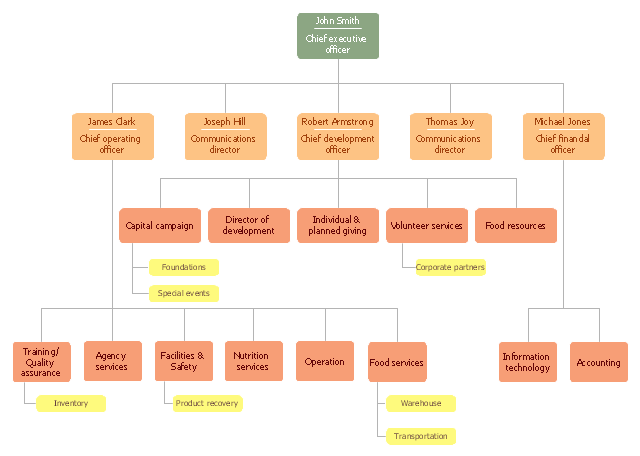
"A food bank or foodbank is a non-profit, charitable organization that distributes food to those who have difficulty purchasing enough food to avoid hunger.
In the United States and Australia, food banks usually operate on the "warehouse" model. They act as food storage and distribution depots for smaller front line agencies; and usually do not themselves give out food directly to the hungry. After the food is collected, sorted, and reviewed for quality, these food banks distribute it to non-profit community or government agencies, including food pantries, food closets, soup kitchens, homeless shelters, orphanages, and schools.
Outside North America and Australia, the "front line" model is often found. Such food banks give out most or all of their food directly to the end users. For both models, the largest sources of food include for-profit growers, manufacturers, distributors and retailers who in the normal course of business have excess food that they cannot sell. Some foodbanks receive a substantial proportion of their food from individual donors, including their volunteer workers. There is considerable overlap with food salvage, food rescue and gleaning, although not with freeganism or dumpster-diving." [Food bank. Wikipedia]
The organization chart example "Foodbank" was created using the ConceptDraw PRO diagramming and vector drawing software extended with the Organizational Charts solution from the Management area of ConceptDraw Solution Park.
Organizational chart
Use the Best FlowChart Tool for the Job

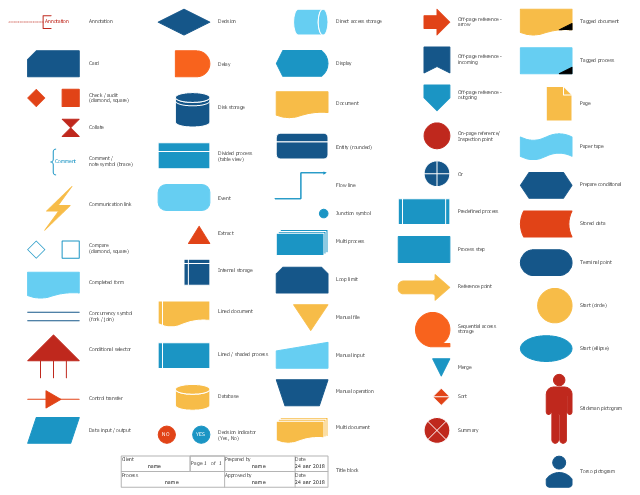
The vector stencils library "Flowchart" contains 26 symbols for drawing the flow charts using the ConceptDraw PRO diagramming and vector drawing software.
"Flowcharts are used in designing and documenting complex processes or programs. Like other types of diagrams, they help visualize what is going on and thereby help the viewer to understand a process, and perhaps also find flaws, bottlenecks, and other less-obvious features within it. There are many different types of flowcharts, and each type has its own repertoire of boxes and notational conventions. The two most common types of boxes in a flowchart are:
(1) a processing step, usually called activity, and denoted as a rectangular box;
(2) a decision, usually denoted as a diamond.
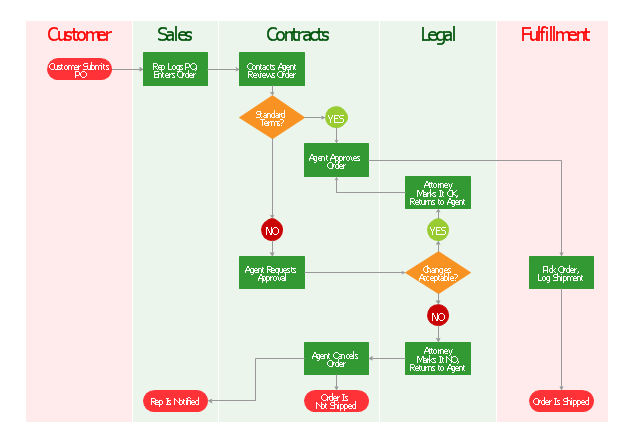
A flowchart is described as "cross-functional" when the page is divided into different swimlanes describing the control of different organizational units. A symbol appearing in a particular "lane" is within the control of that organizational unit. This technique allows the author to locate the responsibility for performing an action or making a decision correctly, showing the responsibility of each organizational unit for different parts of a single process. ...
Common alternate names include: flowchart, process flowchart, functional flowchart, process map, process chart, functional process chart, business process model, process model, process flow diagram, work flow diagram, business flow diagram. The terms "flowchart" and "flow chart" are used interchangeably." [Flowchart. Wikipedia]
The example "Design elements - Flowchart" is included in the Flowcharts solution from the area "What is a Diagram" of ConceptDraw Solution Park.
"Flowcharts are used in designing and documenting complex processes or programs. Like other types of diagrams, they help visualize what is going on and thereby help the viewer to understand a process, and perhaps also find flaws, bottlenecks, and other less-obvious features within it. There are many different types of flowcharts, and each type has its own repertoire of boxes and notational conventions. The two most common types of boxes in a flowchart are:
(1) a processing step, usually called activity, and denoted as a rectangular box;
(2) a decision, usually denoted as a diamond.
A flowchart is described as "cross-functional" when the page is divided into different swimlanes describing the control of different organizational units. A symbol appearing in a particular "lane" is within the control of that organizational unit. This technique allows the author to locate the responsibility for performing an action or making a decision correctly, showing the responsibility of each organizational unit for different parts of a single process. ...
Common alternate names include: flowchart, process flowchart, functional flowchart, process map, process chart, functional process chart, business process model, process model, process flow diagram, work flow diagram, business flow diagram. The terms "flowchart" and "flow chart" are used interchangeably." [Flowchart. Wikipedia]
The example "Design elements - Flowchart" is included in the Flowcharts solution from the area "What is a Diagram" of ConceptDraw Solution Park.
Flowchart notation

The vector stencils library "HR flowchart" contains 62 flow chart symbols.
Use it to design your HR flowcharts, workflow diagrams and process charts by the ConceptDraw PRO diagramming and vector drawing software.
"Flowcharts are used in designing and documenting simple processes or programs. Like other types of diagrams, they help visualize what is going on and thereby help understand a process, and perhaps also find flaws, bottlenecks, and other less-obvious features within it. There are many different types of flowcharts, and each type has its own repertoire of boxes and notational conventions. The two most common types of boxes in a flowchart are:
(1) a processing step, usually called activity, and denoted as a rectangular box,
(2) a decision, usually denoted as a diamond." [Flowchart. Wikipedia]
The shapes example "Design elements - HR flowchart" is included in the HR Flowcharts solution from the Management area of ConceptDraw Solution Park.
Flowchart symbols
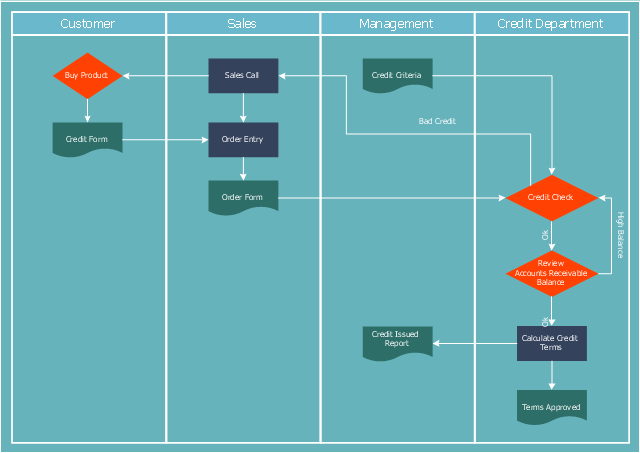
"Credit (from Latin credo translation. "I believe" ) is the trust which allows one party to provide resources to another party where that second party does not reimburse the first party immediately (thereby generating a debt), but instead arranges either to repay or return those resources (or other materials of equal value) at a later date. The resources provided may be financial (e.g. granting a loan), or they may consist of goods or services (e.g. consumer credit). Credit encompasses any form of deferred payment. Credit is extended by a creditor, also known as a lender, to a debtor, also known as a borrower." [Credit (finance). Wikipedia]
The cross-functional (deployment) flowchart example "Credit approval process" was created using the ConceptDraw PRO diagramming and vector drawing software extended with the Cross-Functional Flowcharts solution from the Business Processes area of ConceptDraw Solution Park.
The cross-functional (deployment) flowchart example "Credit approval process" was created using the ConceptDraw PRO diagramming and vector drawing software extended with the Cross-Functional Flowcharts solution from the Business Processes area of ConceptDraw Solution Park.
Credit approval process flowchart
This example of UML class diagram models bank account system.
"A bank account is a financial account between a bank customer and a financial institution. A bank account can be a deposit account, a credit card, or any other type of account offered by a financial institution. The financial transactions which have occurred within a given period of time on a bank account are reported to the customer on a bank statement and the balance of the account at any point in time is the financial position of the customer with the institution. a fund that a customer has entrusted to a bank and from which the customer can make withdrawals." [Bank account. Wikipedia]
This bank account system UML class diagram example was created using the ConceptDraw PRO diagramming and vector drawing software extended with the ATM UML Diagrams solution from the Software Development area of ConceptDraw Solution Park.
UML class diagram of bank account system

The vector stencils library "Bank UML activity diagram" contains 32 shapes of UML activity diagram.
Use it for object-oriented modeling of your bank information system.
"Activity diagrams are constructed from a limited number of shapes, connected with arrows. The most important shape types:
* rounded rectangles represent actions;
* diamonds represent decisions;
* bars represent the start (split) or end (join) of concurrent activities;
* a black circle represents the start (initial state) of the workflow;
* an encircled black circle represents the end (final state).
Arrows run from the start towards the end and represent the order in which activities happen.
Activity diagrams may be regarded as a form of flowchart. Typical flowchart techniques lack constructs for expressing concurrency. However, the join and split symbols in activity diagrams only resolve this for simple cases; the meaning of the model is not clear when they are arbitrarily combined with decisions or loops.
While in UML 1.x, activity diagrams were a specialized form of state diagrams, in UML 2.x, the activity diagrams were reformalized to be based on Petri net-like semantics, increasing the scope of situations that can be modeled using activity diagrams. These changes cause many UML 1.x activity diagrams to be interpreted differently in UML 2.x." [Activity diagram. Wikipedia]
This example of UML activity diagram symbols for the ConceptDraw PRO diagramming and vector drawing software is included in the ATM UML Diagrams solution from the Software Development area of ConceptDraw Solution Park.
UML activity diagram symbols
Settlement Process Flowchart. Flowchart Examples

The vector stencils library "Sales flowchart" contains 62 flow chart symbols.
Use it to design your sales flowcharts, workflow diagrams and process charts by the ConceptDraw PRO diagramming and vector drawing software.
"Flowcharts are used in designing and documenting simple processes or programs. Like other types of diagrams, they help visualize what is going on and thereby help understand a process, and perhaps also find flaws, bottlenecks, and other less-obvious features within it. There are many different types of flowcharts, and each type has its own repertoire of boxes and notational conventions. The two most common types of boxes in a flowchart are:
(1) a processing step, usually called activity, and denoted as a rectangular box,
(2) a decision, usually denoted as a diamond." [Flowchart. Wikipedia]
The shapes example "Design elements - Sales flowchart" is included in the Sales Flowcharts solution from the Marketing area of ConceptDraw Solution Park.
Flowchart symbols
"Order processing is a key element of Order fulfillment. Order processing operations or facilities are commonly called "distribution centers". "Order processing" is the term generally used to describe the process or the work flow associated with the picking, packing and delivery of the packed item(s) to a shipping carrier. The specific "order fulfillment process" or the operational procedures of distribution centers are determined by many factors. Each distribution center has its own unique requirements or priorities." [Order processing. Wikipedia]
The vertical cross-functional flow chart example "Order processing" was created using the ConceptDraw PRO diagramming and vector drawing software extended with the Flowcharts solution from the area "What is a Diagram" of ConceptDraw Solution Park.
The vertical cross-functional flow chart example "Order processing" was created using the ConceptDraw PRO diagramming and vector drawing software extended with the Flowcharts solution from the area "What is a Diagram" of ConceptDraw Solution Park.
Cross-functional flowchart
Sample Project Flowchart. Flowchart Examples


Diagram Flow Chart

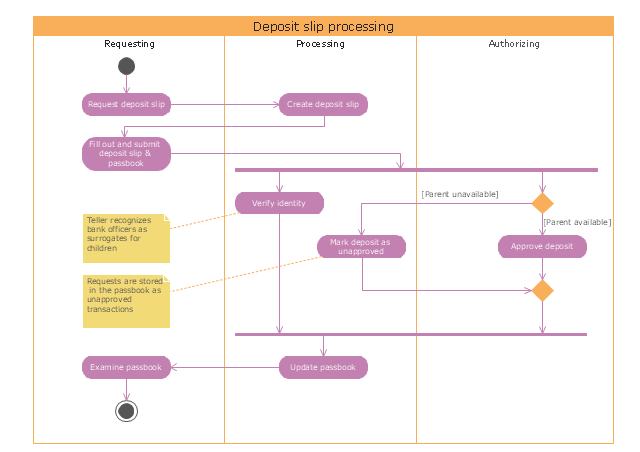
"Credits and deposits.
To add credit to an account by bringing cash to a bank in person, the account holder can fill a small credit slip or deposit slip. The total amount of each note and coin is counted and entered on the slip, along with who it is paid in by and the date. The cash and details are counted and checked by the teller at the bank, if everything is in order the deposit is credited to the account, the credit slip is then kept by the bank and the credit slip booklet is stamped with the date and then returned to the account holder.An account holder uses their passbook to record their history of transactions with their bank." [Passbook. Wikipedia]
The UML activity diagram example "Deposit slip processing" was created using the ConceptDraw PRO diagramming and vector drawing software extended with the Rapid UML solution from the Software Development area of ConceptDraw Solution Park.
UML activity diagram
This example was redesigned from the Wikipedia file: LastResortHotel BookRoom Process.png. [en.wikipedia.org/ wiki/ File:LastResortHotel_ BookRoom_ Process.png]
This file is licensed under the Creative Commons Attribution-ShareAlike 3.0 License. [creativecommons.org/ licenses/ by-sa/ 3.0/ ]
"Event partitioning is an easy-to-apply systems analysis technique that helps the analyst organize requirements for large systems into a collection of smaller, simpler, minimally-connected, easier-to-understand ‘mini systems’ / use cases. ...
Defining requirements.
Single process in a fictitious hotel using data flow diagram notation.
Single use case in a fictitious hotel using use case diagram notation.
This approach helps the analyst to decompose the system into ‘mentally bite-sized’ mini-systems using events that require a planned response. The level of detail of each response is at the level of ‘primary use cases’. Each planned response may be modelled using DFD notation or as a single use case using use case diagram notation.
The basic flow within a process or use case can usually be described in a relatively small number of steps, often fewer than twenty or thirty, possibly using something like ‘structured English’. Ideally, all of the steps would be visible all at once (often a page or less). The intention is to reduce one of the risks associated with short-term memory, namely, forgetting what is not immediately visible (‘out of sight, out of mind’). ...
Single process in a fictitious hotel using data flow diagram notation." [Event partitioning. Wikipedia]
The DFD example "Last resort hotel book room process" was created using the ConceptDraw PRO diagramming and vector drawing software extended with the Data Flow Diagrams solution from the Software Development area of ConceptDraw Solution Park.
DFD

Flow Diagram

"Smaller mobile devices such as PDAs and smartphones typically use the WIMP elements with different unifying metaphors, due to constraints in space and available input devices. Applications for which WIMP is not well suited may use newer interaction techniques, collectively named as post-WIMP user interfaces.
As of 2011, some touch-screen-based operating systems such as Apple's iOS (iPhone) and Android use the class of GUIs named post-WIMP. These support styles of interaction using more than one finger in contact with a display, which allows actions such as pinching and rotating, which are unsupported by one pointer and mouse." [Graphical user interface. Wikipedia]
"In computing post-WIMP comprises work on user interfaces, mostly graphical user interfaces, which attempt to go beyond the paradigm of windows, icons, menus and a pointing device, i.e. WIMP interfaces. ...
However WIMP interfaces are not optimal for working with complex tasks such as computer-aided design, working on large amounts of data simultaneously, or interactive games. WIMPs are usually pixel-hungry, so given limited screen real estate they can distract attention from the task at hand. Thus, custom interfaces can better encapsulate workspaces, actions, and objects for specific complex tasks. Applications for which WIMP is not well suited include those requiring continuous input signals, showing 3D models, or simply portraying an interaction for which there is no defined standard widget.
Interfaces based on these considerations, now called "post-WIMP", have made their way to the general public. Examples include the interface of the classic MP3 player iPod and a bank's automated teller machine screen." [Post-WIMP. Wikipedia]
The example "iPhone OS (iOS) graphic user interface (GUI) - Activity indicator view" was created using the ConceptDraw PRO diagramming and vector drawing software extended with the Graphic User Interface solution from the Software Development area of ConceptDraw Solution Park.
iPhone GUI
-graphic-user-interface-(gui)---activity-indicator-view.png--diagram-flowchart-example.png)
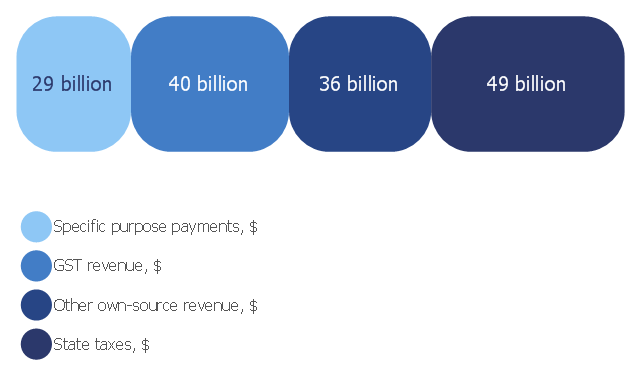
This divided bar diagram sample shows composition of Australian state government revenue in 2006‑2007. It was drawn on the base of the chart "Composition of state government revenue in 2006‑07" from the Australia's future tax system website.
[taxreview.treasury.gov.au/ content/ Paper.aspx?doc=html/ publications/ papers/ report/ section_ 10-06.htm]
"Government revenue is money received by a government. It is an important tool of the fiscal policy of the government and is the opposite factor of government spending. Revenues earned by the government are received from sources such as taxes levied on the incomes and wealth accumulation of individuals and corporations and on the goods and services produced, exported and imported from the country, non-taxable sources such as government-owned corporations' incomes, central bank revenue and capital receipts in the form of external loans and debts from international financial institutions." [Government revenue. Wikipedia]
The divided bar diagram example "Composition of state government revenue in 2006‑07" was created using the ConceptDraw PRO diagramming and vector drawing software extended with the Divided Bar Diagrams solution from the Graphs and Charts area of ConceptDraw Solution Park.
Divided bar chart
This flowchart example was created on the base of land sales process diagram from the Property management webpage of the VicRoads website.
[www.vicroads.vic.gov.au/ planning-and-projects/ property-services/ property-management]
"VicRoads or the Roads Corporation of Victoria is a statutory corporation which is the state road and traffic authority in the state of Victoria, Australia. It is responsible for maintenance and construction of the state arterial road network, as well as driver licensing and vehicle registration. VicRoads has broad responsibility for road safety policy and research. It is also responsible for regulating the accident towing industry in Victoria." [VicRoads. Wikipedia]
"Sales Process.
Once it has been established with the relevant VicRoads Regions/ Projects and other business areas that properties are identified as surplus to VicRoads’ operational needs, they are incorporated in the VicRoads annual sales program.
Following approval: relevant VicRoads Regional Manager and the VicRoads Chief Executive (and in some circumstances Minster for Public Transport and Roads) must approve all land deemed surplus and available for disposal.
The method of sale is then determined and consultant advice is sought:
(1) Planning.
(2) Valuer General Victoria (Valuer General’s office must provide a valuation for all sales).
(3) Government Land Monitor (Land Monitor approval is sought if the value exceeds $750,000).
(4) Environmental.
(5) Local Council." [www.vicroads.vic.gov.au/ planning-and-projects/ property-services/ property-management]
The example "Land sales process flowchart" was created using the ConceptDraw PRO diagramming and vector drawing software extended with the Sales Flowcharts solution from the Marketing area of ConceptDraw Solution Park.
Sales process chart

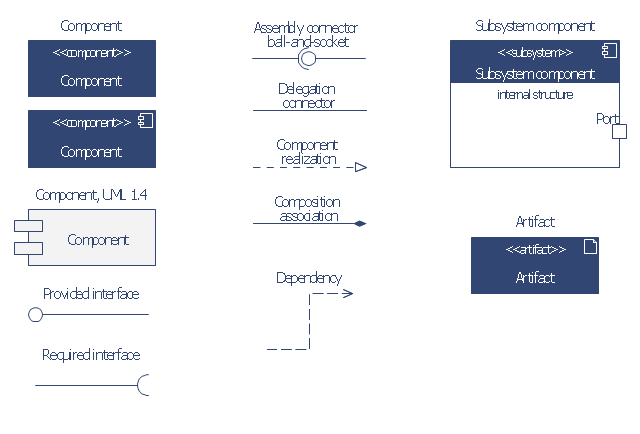
The vector stencils library "Bank UML component diagram" contains 13 shapes for drawing UML component diagrams.
Use it for object-oriented modeling of your bank information system.
"A component is something required to execute a stereotype function. Examples of stereotypes in components include executables, documents, database tables, files, and library files.
Components are wired together by using an assembly connector to connect the required interface of one component with the provided interface of another component. This illustrates the service consumer - service provider relationship between the two components. ...
When using a component diagram to show the internal structure of a component, the provided and required interfaces of the encompassing component can delegate to the corresponding interfaces of the contained components. ...
Symbols.
This may have a visual stereotype in the top right of the rectangle of a small rectangle with two even smaller rectangles jutting out on the left.
The lollipop, a small circle on a stick represents an implemented or provided interface. The socket symbol is a semicircle on a stick that can fit around the lollipop. This socket is a dependency or needed interface." [Component diagram. Wikipedia]
This example of UML component diagram symbols for the ConceptDraw PRO diagramming and vector drawing software is included in the ATM UML Diagrams solution from the Software Development area of ConceptDraw Solution Park.
UML component diagram symbols
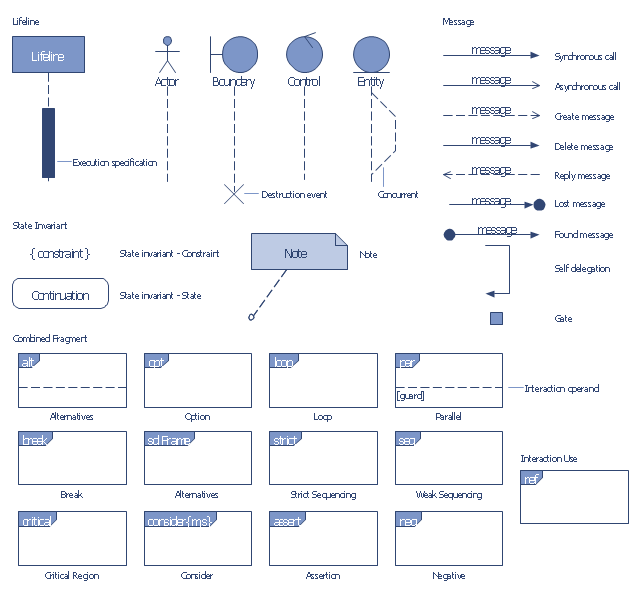
The vector stencils library "Bank UML sequence diagram" contains 34 shapes for drawing UML sequence diagrams.
Use it for object-oriented modeling of your bank information system.
"A sequence diagram shows, as parallel vertical lines (lifelines), different processes or objects that live simultaneously, and, as horizontal arrows, the messages exchanged between them, in the order in which they occur. This allows the specification of simple runtime scenarios in a graphical manner.
Diagram building blocks.
If the lifeline is that of an object, it demonstrates a role. Leaving the instance name blank can represent anonymous and unnamed instances.
Messages, written with horizontal arrows with the message name written above them, display interaction. Solid arrow heads represent synchronous calls, open arrow heads represent asynchronous messages, and dashed lines represent reply messages. ...
Activation boxes, or method-call boxes, are opaque rectangles drawn on top of lifelines to represent that processes are being performed in response to the message (ExecutionSpecifications in UML).
Objects calling methods on themselves use messages and add new activation boxes on top of any others to indicate a further level of processing.
When an object is destroyed (removed from memory), an X is drawn on top of the lifeline, and the dashed line ceases to be drawn below it ...
A message sent from outside the diagram can be represented by a message originating from a filled-in circle (found message in UML) or from a border of the sequence diagram (gate in UML)." [Sequence diagram. Wikipedia]
This example of UML sequence diagram symbols for the ConceptDraw PRO diagramming and vector drawing software is included in the ATM UML Diagrams solution from the Software Development area of ConceptDraw Solution Park.
UML sequence diagram symbols
- Event-driven Process Chain Diagrams | Entity-Relationship Diagram ...
- Financial Comparison Chart | Risk management - Audit flowchart
- Flowchart Components | UML use case diagram - Banking system ...
- UML use case diagram | Use Case Diagram For Banking System Wiki
- UML use case diagram - Banking system | Sales Flowcharts ...
- UML use case diagram - Banking system | Class UML Diagram for ...
- UML use case diagram - Banking system | Interactive Voice ...
- UML use case diagram - Banking system | Sales Process Flowcharts
- Coad/Yourdon's Object-Oriented Analysis model | Object Oriented ...
- Flowchart Components | UML activity diagram - Banking system