A picture chart (image chart, pictorial graph) is the type of a bar graph visualizing numarical data using symbols and pictograms.
In the field of economics and finance use a picture graph with columns in the form of coins. For population comparison statistics use a chart with columns in the form of manikins. To show data increase or decrease use arrows bar charts.
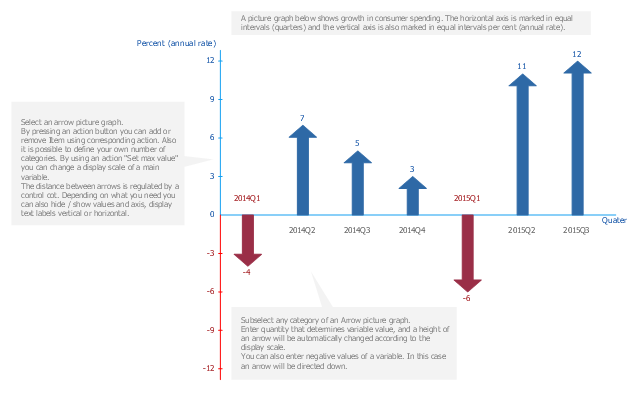
The arrow chart template "Picture graph" for the ConceptDraw PRO diagramming and vector drawing software is included in the Basic Picture Graphs solution from the Graphs and Charts area of ConceptDraw Solution Park.
In the field of economics and finance use a picture graph with columns in the form of coins. For population comparison statistics use a chart with columns in the form of manikins. To show data increase or decrease use arrows bar charts.
The arrow chart template "Picture graph" for the ConceptDraw PRO diagramming and vector drawing software is included in the Basic Picture Graphs solution from the Graphs and Charts area of ConceptDraw Solution Park.
Arrows bar graph template
The vector stencils library "Picture Graphs" contains 35 templates of picture bar graphs for visual data comparison and time series.
Drag a template from the library to your document, set bars number, type category labels, select bars and enter your data.
Use these shapes to draw your pictorial bar charts in the ConceptDraw PRO diagramming and vector drawing software.
The vector stencils library "Picture Graphs" is included in the Picture Graphs solution from the Graphs and Charts area of ConceptDraw Solution Park.
Arrow
Water drop

Food

Grain

Agriculture

Medicines

Houses

Buildings

Money bags

Oil barrels

Natural gas

Electrical power

Nuclear power

Mechanical engineering

Chemical industry

Mining

Gold bars

Coins

Person

Men, women and children

Man

Woman

Child

Milk

Meat

Fruits

Vegetables

Computer

Mobile phone

Airliner

Car

Bus

Truck

Train

Cargo ship

Bubble diagrams in Landscape Design with ConceptDraw DIAGRAM

 Circular Arrows Diagrams
Circular Arrows Diagrams solution extends ConceptDraw DIAGRAM with extensive drawing tools, predesigned samples, Circular flow diagram template for quick start, and a library of ready circular arrow vector stencils for drawing Circular Arrow Diagrams, Segmented Cycle Diagrams, and Circular Flow Diagrams. The elements in this solution help managers, analysts, business advisers, marketing experts, scientists, lecturers, and other knowledge workers in their daily work.
- How to Draw a Landscape Design Plan | Arrow Round Ribbon Images
- Pictures Of Round Arrow
- Round Arrow Images
- Bar Graph | Divided Bar Diagrams | Stacked Images Arrow
- Chart Maker for Presentations | Mathematics | Red Angle Arrow ...
- Double Headed Arrow Images
- Image For Dropdownlist Arrow
- Circle Arrow Shape Images
- Opposite Arrow Image
- Arrows Images
- Circular Arrows Diagrams | Fishbone Diagram | Pyramid Charts ...
- Image Arrow For Presentation
- Basic Flowchart Symbols and Meaning | Circular Arrows Diagrams ...
- Double Arrow Image
- Moving Arrow Pictures
- Png Image Arrow
- Curved Arrow Png Images
- Advanced Pie Chart Images With Arrow Connectors
- Arrow circle chart - Template | Basic Flowchart Symbols and ...
- Arrows Bar Chart